
STEEL CLEANLINESS / FRACTURE / QUALITY CONTROL
Non-Metallic Inclusions in Steel: What Hardness Tests Cannot Tell You
Look inside the steel. Identify the particles, follow the crack to its origin, and learn what to ask of an inclusion report for grinding rods and shaft stock.
A steel bar can meet its hardness requirement and still contain a particle from which a fatigue crack can grow. The hardness reading describes resistance to indentation at the test location. It tells us very little about an isolated oxide cluster elsewhere in the bar, or a long sulfide lying across a highly stressed section.
Non-metallic inclusions are particles embedded in the steel, commonly oxides, sulfides or more complex compounds. Steel cleanliness describes their population: how many there are, how large they are, what they contain and how they are distributed. For engineers buying grinding rods, shaft stock and other loaded bar products, this is a separate part of material quality from chemistry and hardness.
Open image at full size ↗
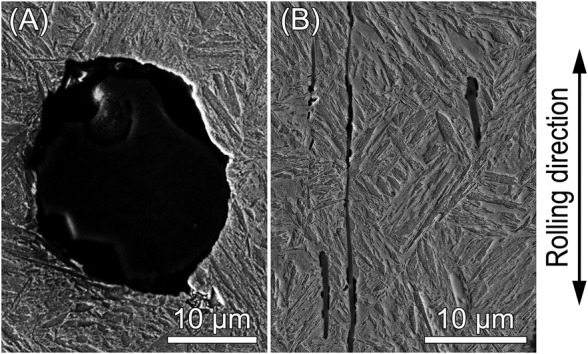
The two particles above belong to the same research steel. One is relatively compact; the other follows the rolling direction. That difference in geometry becomes important when we ask how a component is loaded. Schönbauer and colleagues examined this thermomechanically processed, directly quenched Ck45M steel under both axial and torsional fatigue. Their work connects the particles seen in a metallographic section with the origins found on broken specimens. 1
A representative inspection describes the steel supplied. A fracture investigation identifies what happened at a particular failure origin. A useful quality programme needs both kinds of evidence, with each result tied to its specimen, method and loading context.
1. Where non-metallic inclusions in steel come from
Making steel involves reactions as well as removal. When aluminium is used to reduce dissolved oxygen, the reaction produces alumina. Some reaction products enter the slag; others remain in the metal. Further reactions during refining, cooling and solidification alter the particles that survive. Steel may also acquire inclusions through reoxidation, entrained slag and contact with refractory materials. Zhang and Thomas describe these different sources in their review of steel cleanliness. 2
This is why “vacuum degassed” and “clean steel” should lead to further questions. A process description identifies part of the manufacturing route. An inclusion report describes a sampled result. Buyers need to connect the two through the heat number and the delivered product.
An industrial investigation of aluminium-deoxidized 42CrMo4 makes the point particularly well. Qiao and colleagues observed magnesium–aluminium oxide inclusions during ladle refining and calcium-bearing complex oxides later in the process. They also examined how interactions with slag and refractories changed the inclusion chemistry. The surviving population therefore reflected the sequence of operations, rather than the name of the steel grade alone. 3
A particle's shape carries part of its history
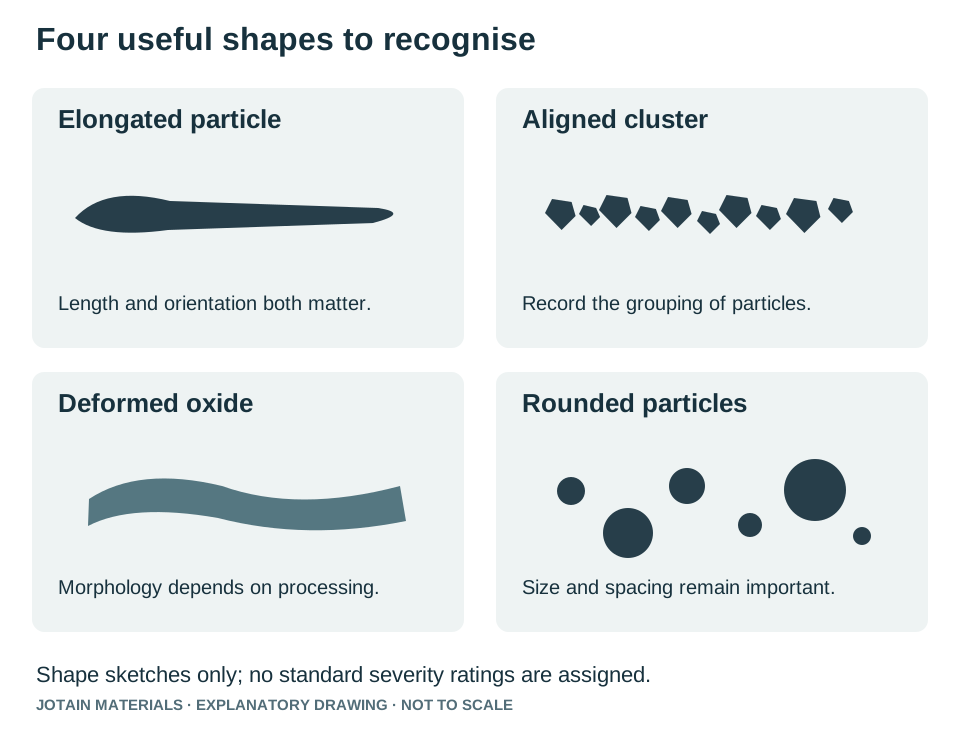
During hot working, a deformable inclusion may lengthen with the steel. A harder particle may remain compact, fragment or form a string of separated pieces. The resulting shape depends on composition, temperature and deformation. These differences help explain why a longitudinal section can look very different from a transverse one.
Open image at full size ↗
It is also a mistake to regard every inclusion as having the same metallurgical purpose. Sulfide additions and inclusion modification can improve machinability in appropriate steels. Ånmark, Karasev and Jönsson explain how inclusion properties influence chip formation, tool wear and the cutting interface. A composition chosen for convenient machining must still satisfy the component's mechanical requirements. 4
For an order, the useful question is specific: which inclusion characteristics matter in this product, after this manufacturing route, under this loading? “Very clean” is too incomplete to serve as an acceptance requirement.
2. Learn to separate an inclusion from the surrounding microstructure
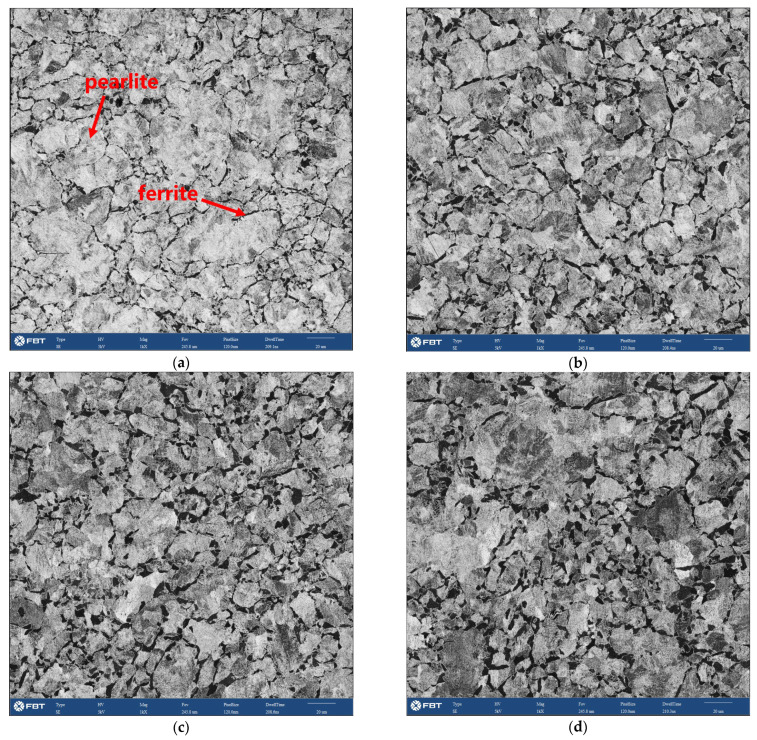
Metallographic images contain several kinds of information at once. Grain boundaries, ferrite, pearlite and martensitic features belong to the steel's microstructure. Inclusions are particles within that structure. A dark region in an etched image may be a phase, a particle, a pit left by preparation, or simply a region with a different response to the illumination.
Open image at full size ↗
The images above show the surrounding structure at different positions in a railway-wheel rim, examined by Li and colleagues. Use this distinction when comparing reports: an etched micrograph selected to demonstrate heat treatment answers a different question from an inclusion survey on a polished, unetched face. The preparation condition belongs in the caption and in the laboratory record. 8
For routine optical examination, a well-prepared steel surface provides a bright background against which many inclusions appear dark. Evident's microscopy guidance describes reflected-light, brightfield observation and calibrated image analysis for this purpose. The contrast makes particles easier to detect, but a dark silhouette does not establish their chemical composition. 10
Open image at full size ↗
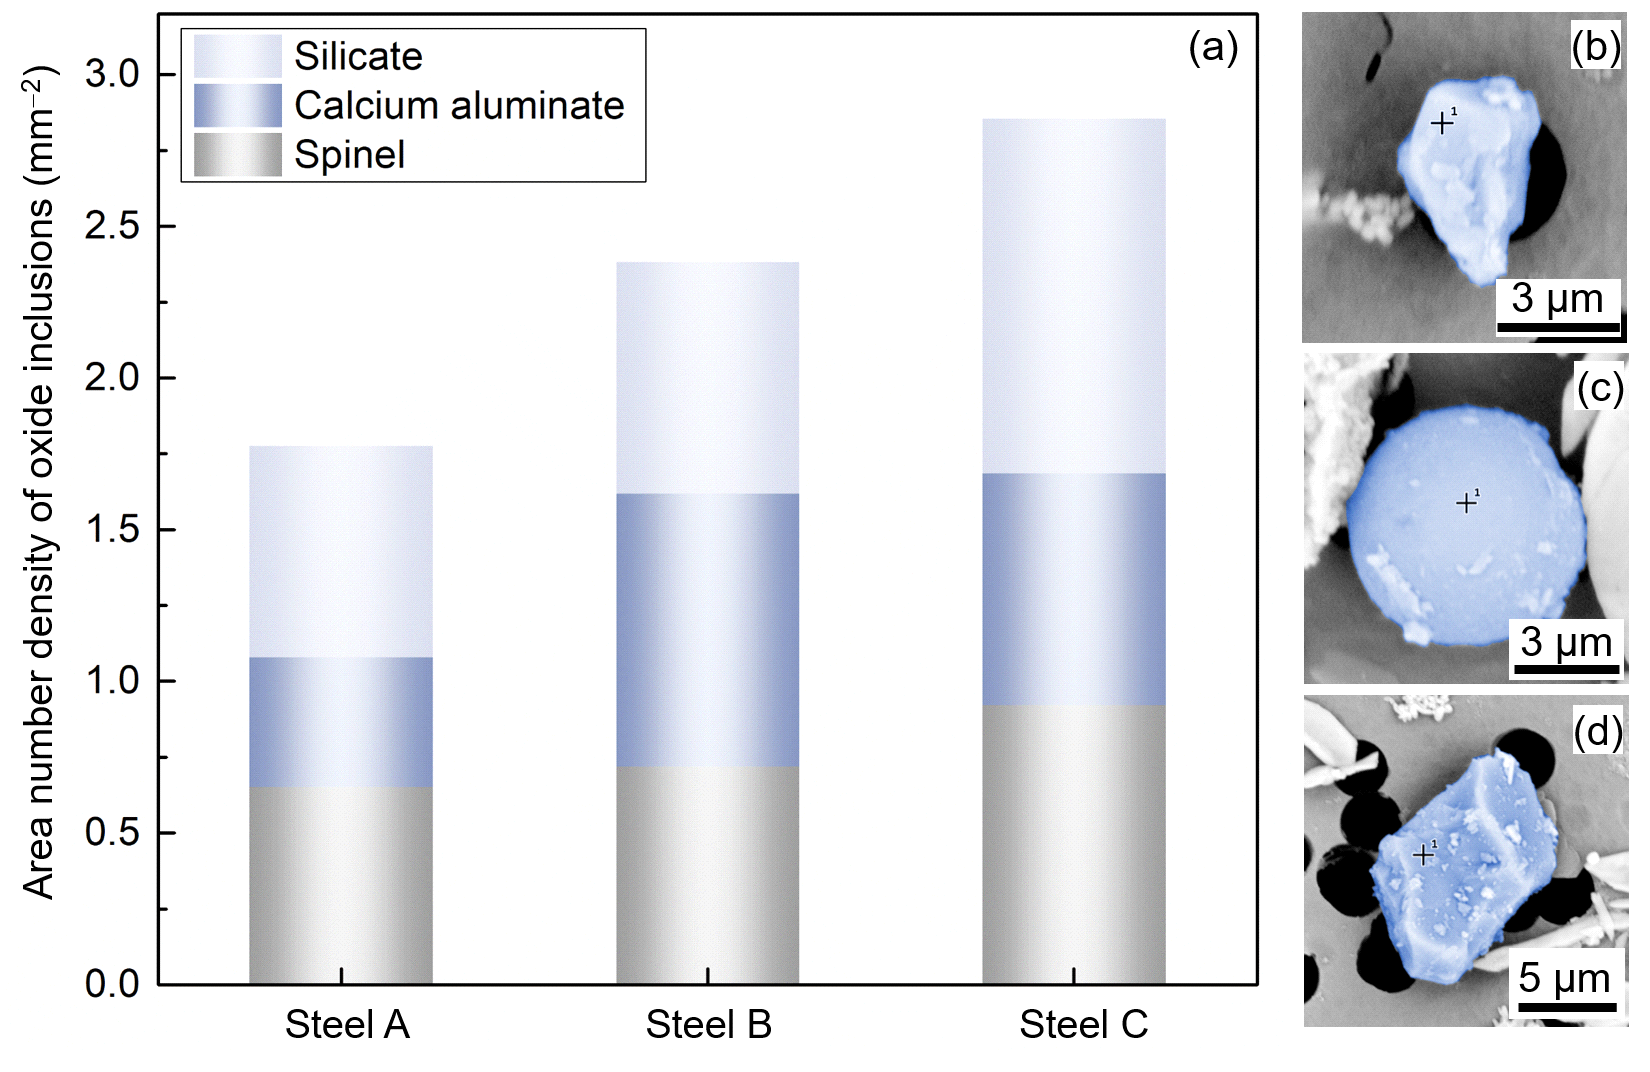
The research figure above combines particle counts with extracted oxide images. The rounded calcium aluminate and more angular spinel help explain why morphology is useful. They also show why a single attractive micrograph is a poor substitute for the surveyed population. The laboratory needs to say how the images were chosen, what area was examined and which particles entered the count. 6
3. Use chemistry to identify the particle
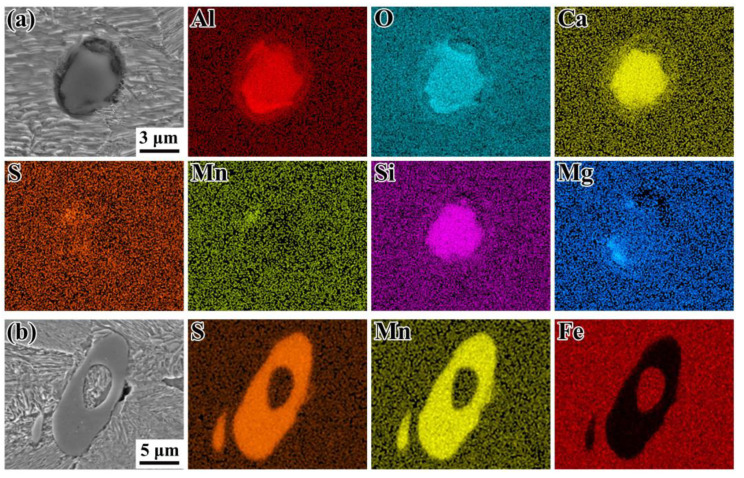
Scanning electron microscopy, or SEM, provides more detail of an inclusion and its interface with the steel. Energy-dispersive X-ray spectroscopy, usually abbreviated EDS or EDX, adds elemental information. Read the image and chemical data together: the image shows the feature that was analysed; the spectrum or map shows the elements detected there.
Open image at full size ↗
In Liu and colleagues' pearlitic wheel-steel study, the mapped oxide and elongated manganese sulfide illustrate this combined approach. The element maps locate the chemistry within the visible feature. 5
Ask whether the reported analysis came from a polished cross-section, an extracted particle or a rough fracture surface. These geometries expose different parts of the inclusion. For a small particle, the surrounding steel can contribute to the measured signal; multiphase inclusions may need several measurement points. A spectrum should therefore be accompanied by the image, analysis position and measurement conditions.
Chemical or electrolytic extraction allows the surrounding matrix to be removed so that an inclusion can be examined in three dimensions. Ramesh Babu and Michelic describe the advantages of this approach, together with the need to select an extraction procedure suited to the particles being investigated. Extraction can reveal shapes that a single polished plane cuts only partially. 9
This distinction has a practical consequence. “Alumina-type” on a morphology-based rating sheet and an aluminium–oxygen signal in an EDS analysis are related pieces of evidence, but they are different measurements. Record each result in its own terms.
4. Why equal hardness does not mean equal fatigue behaviour
Hardness is essential to the specification of a quenched and tempered bar. It helps establish the matrix condition. An inclusion adds a local discontinuity to that matrix, however, and its effect depends on more than the bulk hardness reading.
Four questions organise the investigation:
- Size: how large is the relevant particle, cluster or associated crack?
- Position: is it at the surface, near the surface, or deeper in the stressed section?
- Orientation: how does its long axis lie relative to the applied stress?
- Interface: is the particle bonded to the matrix, separated from it, or already cracked?
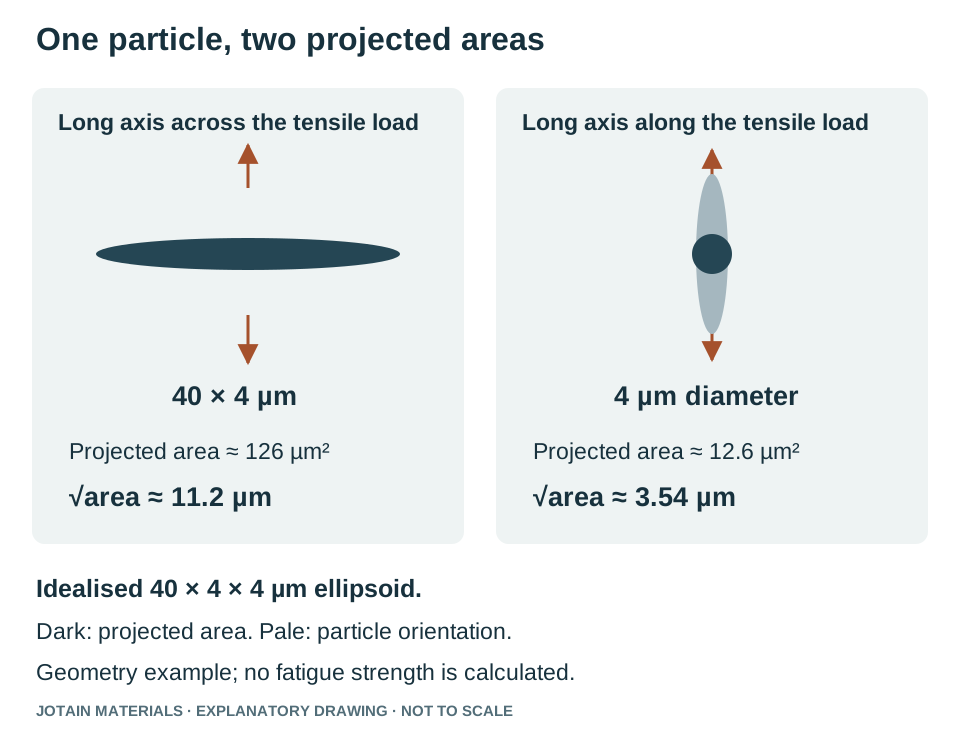
Small-defect fatigue models often describe size through √area, the square root of the defect area projected onto a specified plane. This is a length, normally expressed in micrometres. It is distinct from an inclusion severity rating and from the longest visible dimension. The Ck45M study discusses this approach alongside hardness and load ratio. 1
Open image at full size ↗
A worked geometry example
Consider an idealised elongated particle, 40 µm long and 4 µm across. Viewed broadside, its elliptical projection has an area of π × 20 × 2, or approximately 126 µm². Its √area is therefore approximately 11.2 µm. Viewed end-on as a 4 µm diameter circle, the projected area is approximately 12.6 µm² and √area is 3.54 µm.
The particle has not changed; the projection has. This calculation explains the geometry only. To assess fatigue, the engineer must also establish the stress state, surface position, matrix condition and the validity of the chosen model for the component.
It also explains why a photograph needs an orientation arrow. Without one, a long dark feature is merely a shape on a page. With the rolling and loading directions recorded, it becomes evidence that can be interpreted.
5. Follow the crack back to its origin
A fracture surface is a record of damage development. Start with the whole broken section, locate the suspected origin, and then increase magnification. Searching only for an inclusion at high magnification risks finding a particle that happened to be exposed when the final fracture passed through it.
Open image at full size ↗
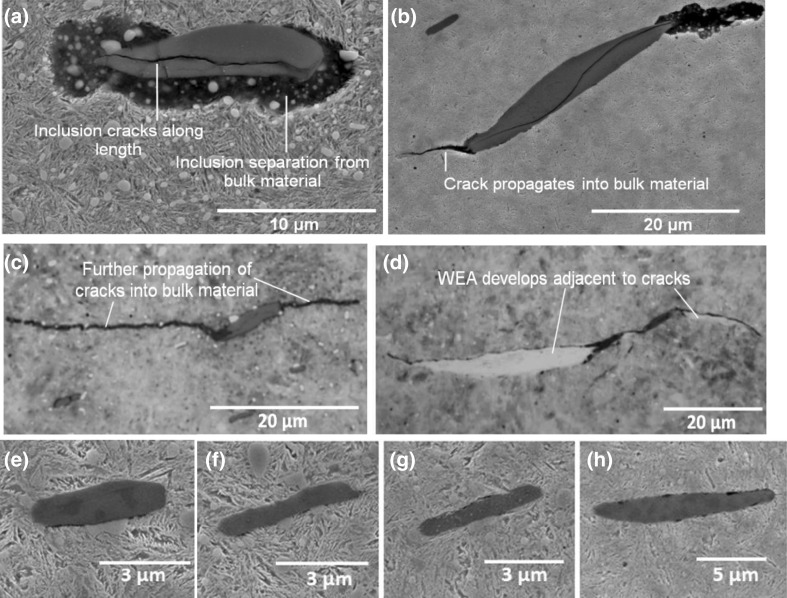
Bruce, Long and Dwyer-Joyce documented several forms of damage around manganese sulfide inclusions in a failed wind-turbine gearbox bearing: separation at the interface, cracking within a particle, and cracks extending into the steel. Their figure also includes undamaged inclusions. The useful lesson is to inspect the condition of the interface as carefully as the particle itself. 7
Open image at full size ↗
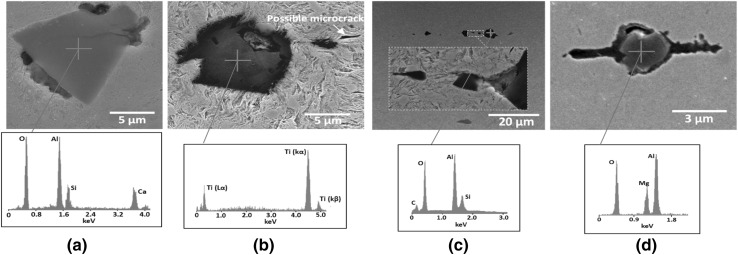
Their experimental work also records damage near oxide inclusions. These images belong to a bearing investigation involving impact and rolling-contact loading. They provide a close view of local damage mechanisms; the operating conditions for a grinding rod must be established from its own service history. 7
The full section, the fish-eye, the particle
Open image at full size ↗
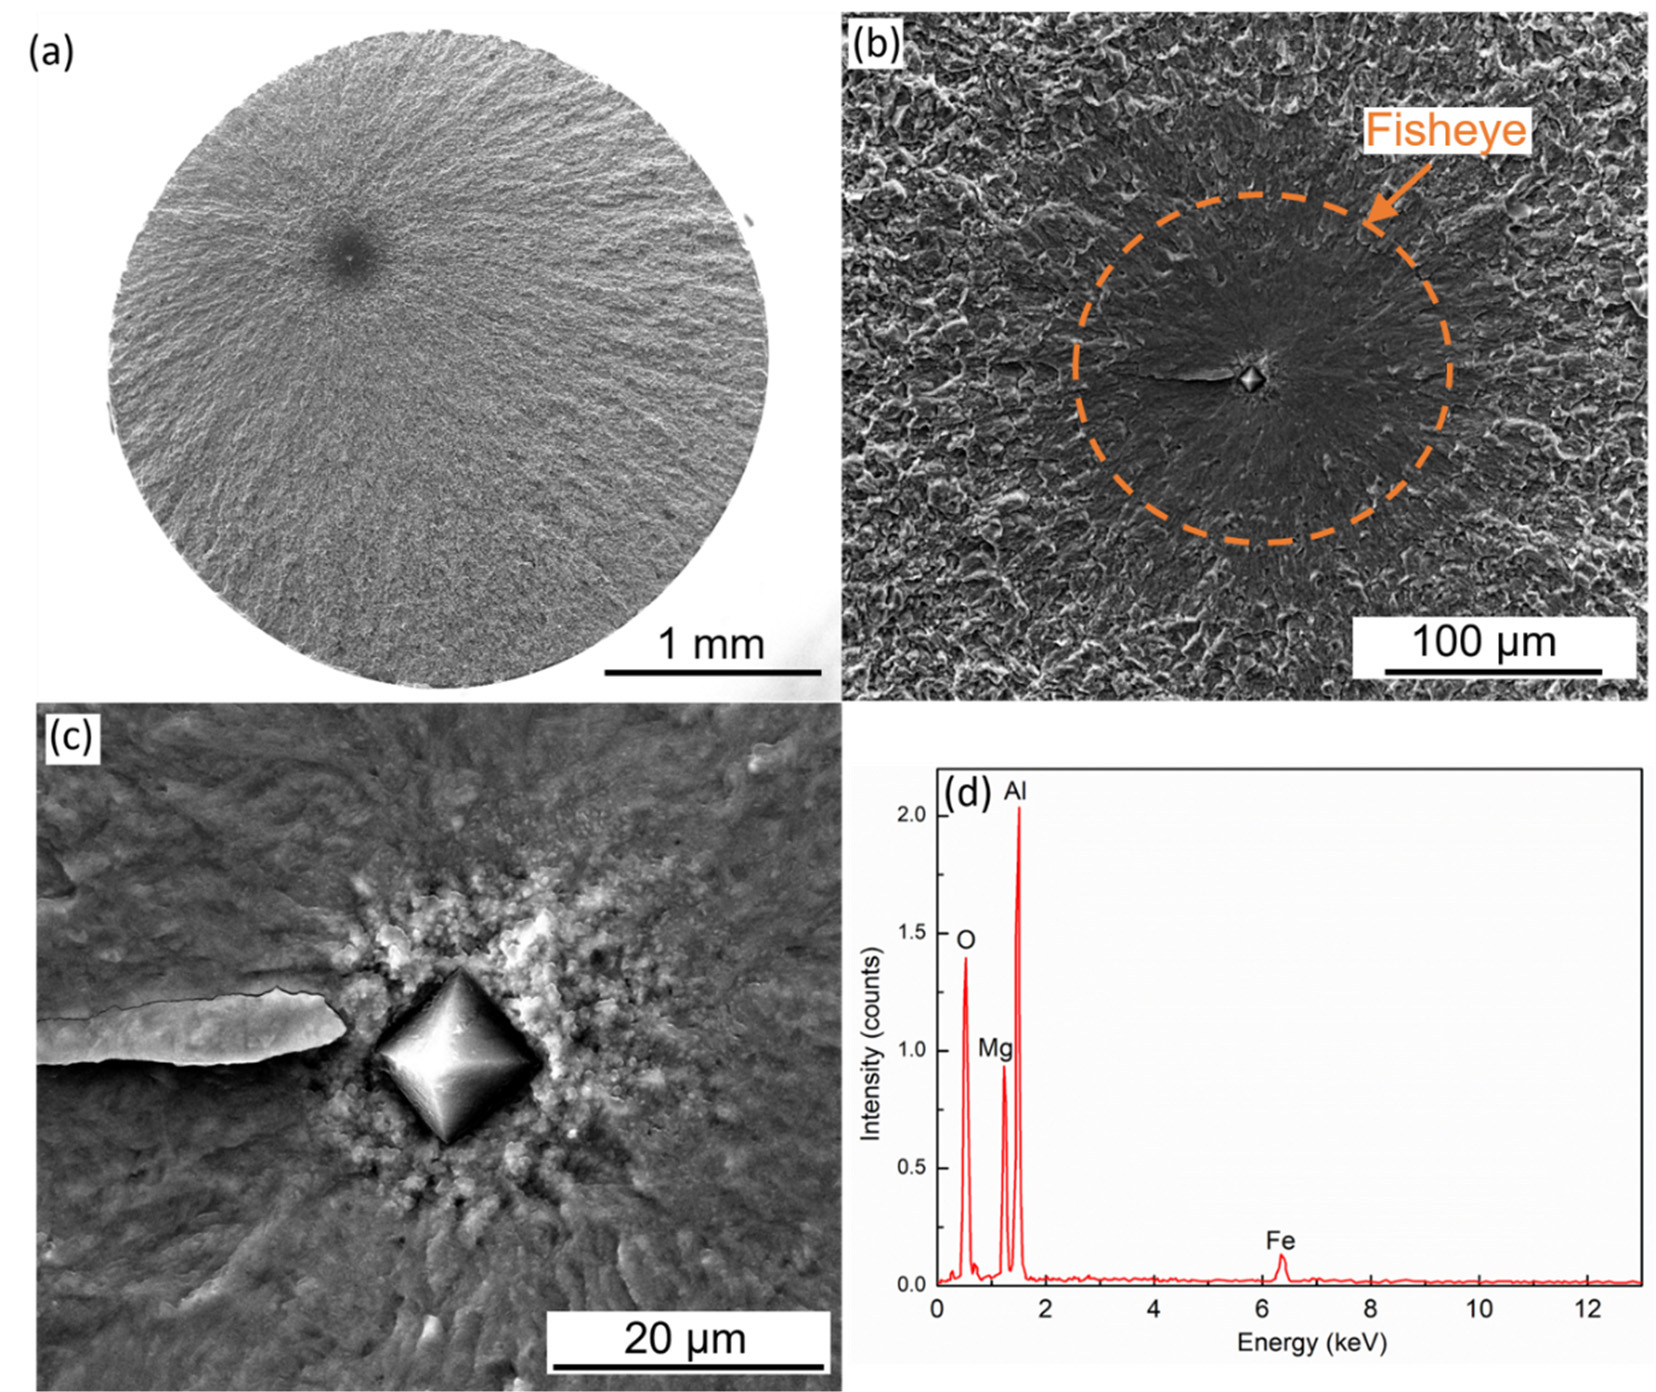
Gu and colleagues provide a particularly clear sequence: the broken specimen, the surrounding fish-eye region, the particle at the origin, and its EDS spectrum. Their bearing-steel specimens were tested in fully reversed axial loading at 20 kHz. Read the four panels as one chain of evidence. 6
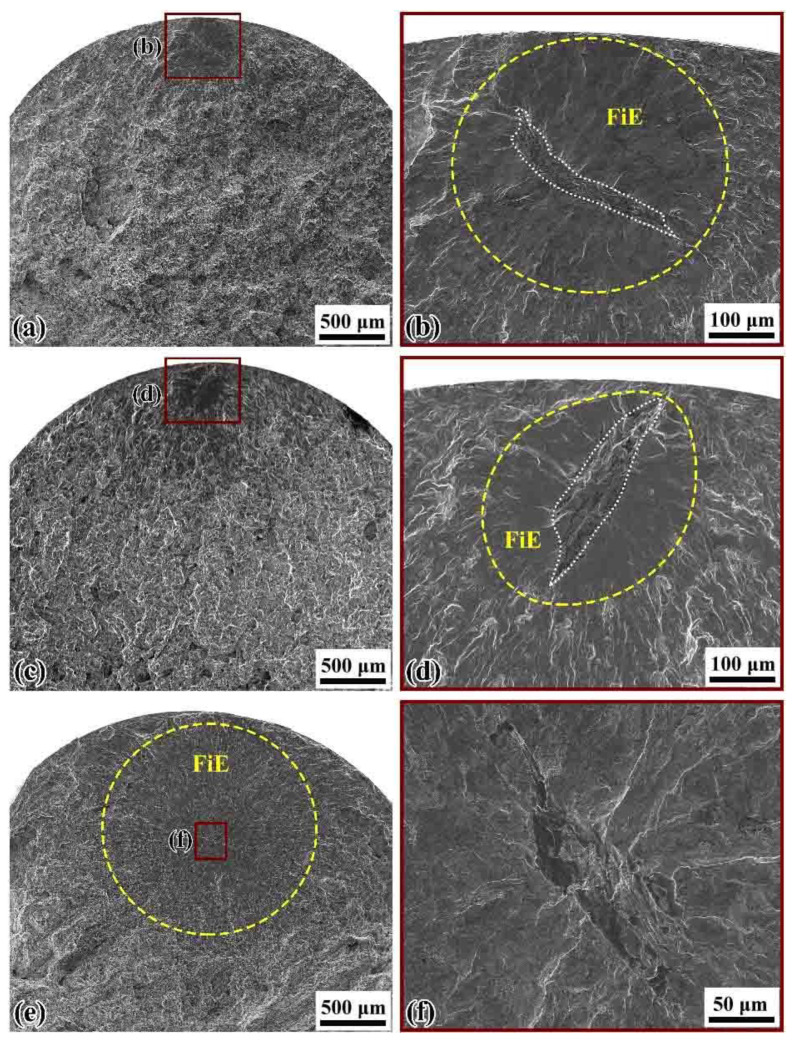
A fish-eye is a fracture-surface feature associated with internal fatigue growth in these examples. Its outline guides the examination toward an origin. The next task is to identify what occupies that origin and to relate it to the surrounding crack-growth features.
Open image at full size ↗
The elongated origins in the wheel-steel examples make a useful comparison with the compact oxide. The original panels retain their scale bars and loading conditions are given below the image. Stress amplitude, load ratio and test frequency are part of the result, just as the steel composition is. 5
Open image at full size ↗
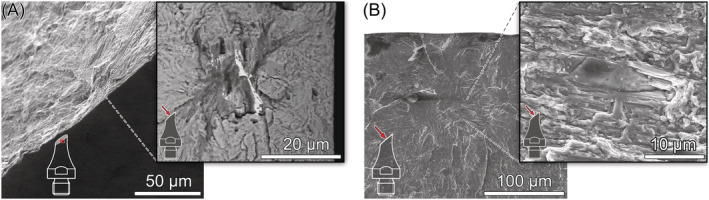
The Ck45M torsion examples extend the comparison to a different stress state. A report on a shaft should distinguish bending, axial loading and torsion, including any combination of them. The location and direction of a crack must make sense within that loading history. 1
6. Prepare and sample the steel so the result means something
Good microscopy starts before the microscope. The laboratory needs a specimen whose position, orientation and preparation are known. A finely polished face with an uncertain origin can produce an excellent photograph and an unusable acceptance result.
Preserve particles during preparation
Cutting, grinding and polishing can remove particles, smear the matrix over them or introduce contamination. Struers' preparation guidance describes pull-outs, embedded abrasives and relief as distinct artefacts. Examine the surface through the preparation sequence, retain inclusions in the matrix and resolve doubtful features before measuring them. 11
An apparent cavity deserves particular attention. It may represent porosity, a particle lost during polishing, or a separation that existed in the material. Re-preparation, adjacent sections and microscopy at an appropriate scale can help distinguish these possibilities. Preserve the original images so that the investigation can explain how its interpretation developed.
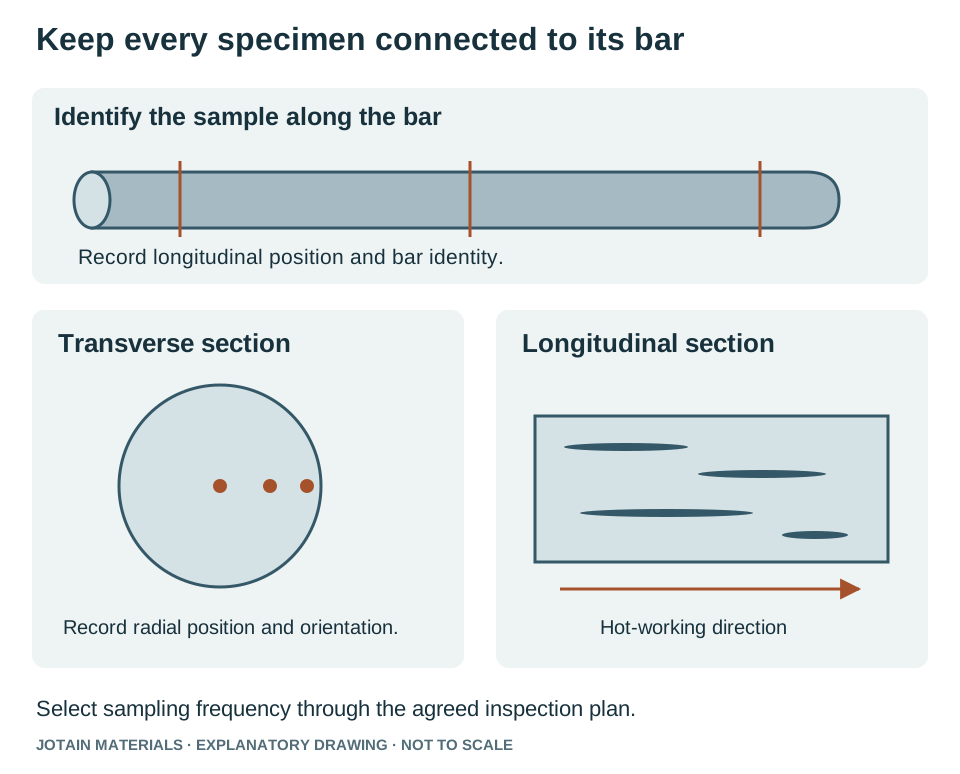
Keep the specimen connected to the bar
Open image at full size ↗
The sampling sketch is a planning aid. On the order and laboratory request, identify the heat and product lot, the bar or billet selected, the position along its length, the radial location and the section orientation. Distinguish a longitudinal face used to examine stringers from a transverse face selected to investigate another feature.
An agreed sample plan also answers an easily overlooked question: what population does this result represent? It might represent one specimen, one selected bar, a defined production lot or a heat under a specified sampling rule. Write that relationship down before testing.
For a failure investigation, preserve the fracture and compare material near the origin with material farther away. Record any cutting, cleaning or handling that could change the surface. Photographs of the intact part, the failed location and the specimen layout make the microscopy much easier to interpret.
7. Choose the measurement that answers the question
“Inclusion test” is too broad a description. Different methods describe different features of the population, and their results should retain the method that produced them.
| Method or evidence | Useful question | What the report needs |
|---|---|---|
| Optical inclusion rating | What morphology and severity were observed on the examined section? | Standard, edition, method, specimen orientation and results by category |
| Quantitative image analysis | How much was detected, how large were the features, and how were they distributed in the measured area? | Calibration, detection threshold, measured area, size definition and counting rules |
| SEM with EDS | What is the morphology and elemental composition of a selected particle? | Analysis location, image, spectrum or map, and instrument conditions |
| Extraction and three-dimensional examination | What shape does the particle have outside a single polished plane? | Extraction procedure, particle retention and identification criteria |
| Extreme-value analysis | What does a defined sample population suggest about its largest indigenous inclusions? | Sampling basis, fitted model, extrapolation area or volume, and uncertainty |
| Ultrasonic examination | Are there reportable internal indications under the agreed examination procedure? | Coverage, reference reflectors, sensitivity, acceptance class and indication record |
Open image at full size ↗
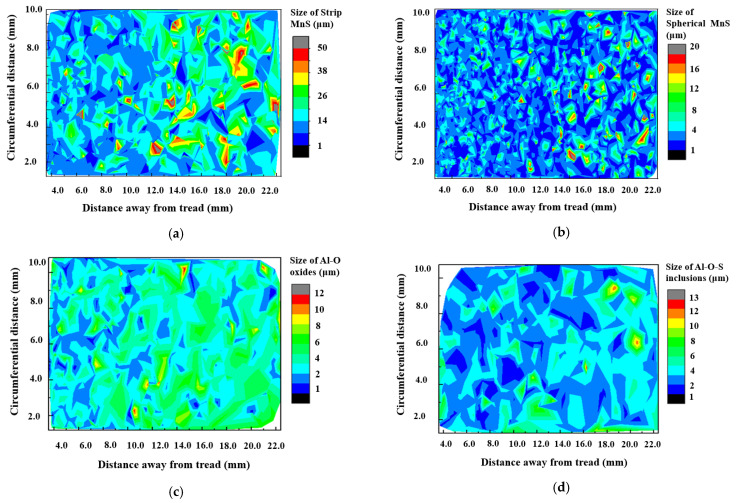
Li and colleagues mapped inclusion sizes across a railway-wheel rim. Their separate maps for elongated sulfides, spherical sulfides, oxides and complex inclusions preserve information that would disappear into one overall average. For bar inspection, the corresponding lesson is to retain specimen position and inclusion category when comparing results. 8
Standards and editions matter
ASTM E45-25 provides procedures for assessing inclusion content in wrought steel. Its microscopic classifications are based on morphology: size, shape, concentration and distribution. Chemistry may require a separate analysis. Its scope also makes clear that the method itself does not set acceptance limits for a steel grade. 12
ISO 4967:2026 is the current ISO micrographic standard, published in May 2026 and replacing the 2013 edition. Its scope covers rolled or forged steel products with a reduction ratio of at least 3, using reference-chart images or image analysis. Identify the edition on new orders and read older reports against the edition they actually used. 13
ASTM E1245-03(2023) addresses automatic image analysis of inclusions and other second-phase constituents. ASTM E2283-08(2019) addresses extreme-value analysis of indigenous inclusions and other microstructural features; its stated scope excludes assessment of exogenous inclusions. These are different analytical purposes, rather than interchangeable ways of writing one cleanliness number. 14 15
When comparing two suppliers, align the specimen position, preparation, method, edition and reporting basis first. A difference in the reported number is much easier to interpret once those conditions are the same.
Keep microscopy and ultrasonic testing together
Ultrasonic examination and metallography work at different scales and answer different questions. An acceptable ultrasonic report means the part met the agreed ultrasonic requirements. A metallographic cleanliness requirement still needs its own sampling and examination. The existing guide to ultrasonic testing of steel round bars explains how to specify that examination.
8. Read an inclusion report from the heading downward
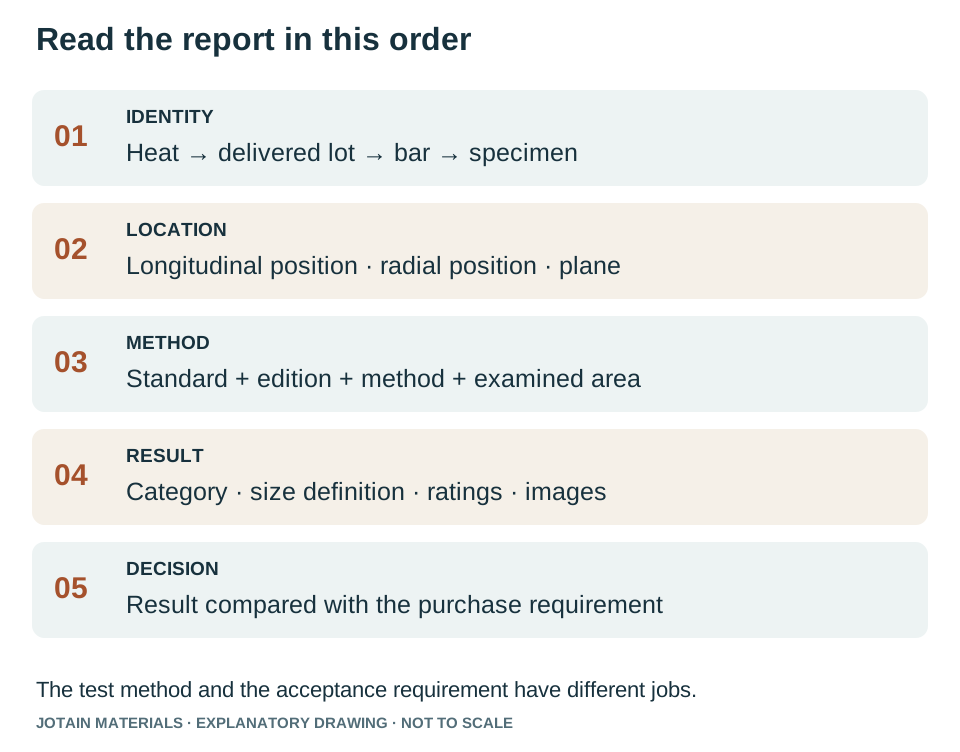
Begin with identity and method before reading the ratings. The report should let another metallurgist reconstruct what was examined and how the result was obtained.
Open image at full size ↗
| Report item | What to look for when reviewing it |
|---|---|
| Material identity | Heat number, grade, product dimensions, supply condition and link to the delivered lot |
| Specimen location | Bar identification, longitudinal position, depth or radial position, and section orientation |
| Examination basis | Standard and edition, selected method, preparation condition, calibration and examined area |
| Inclusion results | Separate categories and thickness groups where applicable; stated size definitions for numerical measurements |
| Supporting images | Scale bars, specimen or field identifiers, and an explanation of how the fields were selected |
| Unusual findings | Large or atypical particles, clusters, preparation concerns, or features requiring further identification |
| Acceptance decision | The exact purchase or product-specification clause used to reach the decision |
The last row is crucial. A test result becomes an acceptance decision only after it is compared with the governing requirement. A laboratory should be able to point to that requirement rather than relying on a general statement that the material is “good.”
Averages and the most severe observed field also describe different things. Ask which result is being reported. If fatigue assessment requires attention to unusually large inclusions, agree a suitable sampling and statistical approach with the laboratory instead of trying to infer the upper tail from an average alone. 15
Total oxygen is useful in steelmaking control, but it does not by itself describe the shape, size or position of every oxide in a finished bar. Zhang and Thomas recommend combining methods because no single measurement captures all aspects of cleanliness. 2
9. Apply the evidence to grinding rods and shafts
Open image at full size ↗
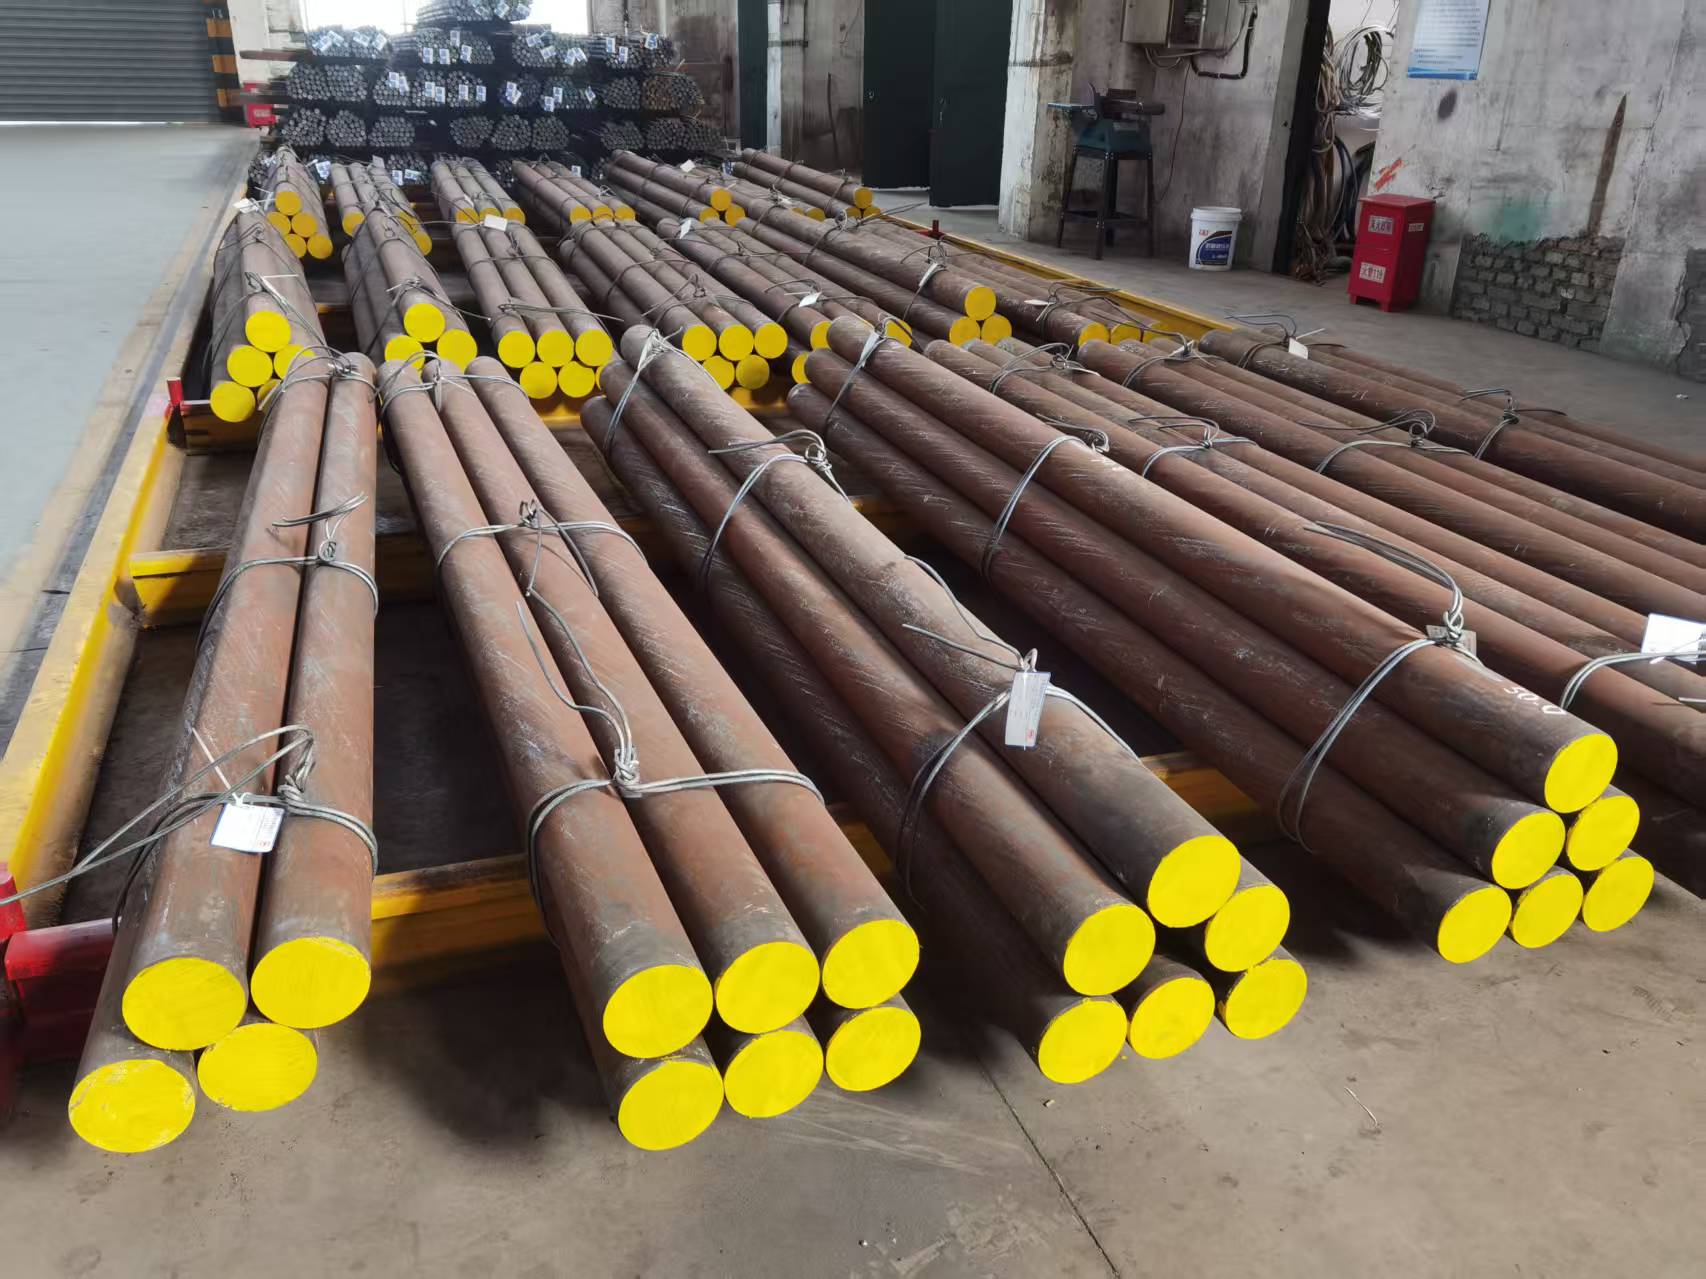
For grinding rods, organise a breakage investigation around the sequence of events. Establish the rod's initial dimensions, delivered hardness profile, service time, wear condition and position of the fracture. Record bending or entanglement, changes in mill operation and any concentration of failures within a heat or delivery lot. Then examine the fracture origin and surrounding steel.
If an inclusion lies at the origin, compare its chemistry and geometry with the inclusion population in the same rod and in retained material from that lot. If a crack begins at a surface defect, investigate that feature with equal care. The purchase specification should be revised in response to the identified mechanism and the production evidence.
| Product situation | Evidence to bring together | Resulting purchasing question |
|---|---|---|
| Repeated grinding-rod breakage | Fracture origins, rod wear, hardness profile, heat identity and operating history | Is a defined cleanliness requirement needed alongside the existing hardness and dimensional requirements? |
| Shaft fatigue near a shoulder or keyway | Origin location, surface condition, stress concentration, load history and inclusion orientation | Does the inspection plan address the material and location that govern fatigue? |
| Machined components requiring reliable chip control | Machining observations, sulfur specification, inclusion morphology and mechanical results | Has the machinability–mechanical-property balance been agreed for this component? |
This sequence keeps the investigation useful to production. A blanket request for lower sulfur may conflict with an established machining requirement. An unchanged hardness target may leave an important inclusion issue unaddressed. The objective is a requirement that follows the failure evidence and can be measured consistently.
Use this article alongside the grinding-rod breakage and bending guide and the shaft fatigue, toughness and inspection guide. For cracks beginning in a soft surface layer, the decarburization article provides the complementary examination route.
10. Put an inspectable requirement on the order
A concise specification can be rigorous. Give the laboratory the information needed to select specimens, perform the agreed examination and judge the results. The following wording is a drafting framework; complete its requirements with the responsible engineer and supplier.
Supply an inclusion assessment traceable to the delivered heat and product lot. State the agreed standard, edition and method; define specimen quantity, location and orientation; report the required inclusion categories and measurements with the examined area and calibrated supporting images. Assess the results against the inclusion limits in the purchase specification. Record atypical or oversized features separately and resolve them through the agreed review procedure before acceptance.
Complete the order with seven decisions:
- Product and condition: grade, section size, manufacturing route and delivery heat treatment.
- Traceability: the relationship between the heat, delivered lot and test specimens.
- Sampling: specimen quantity, selection rule, position and orientation.
- Test method: standard, edition and any permitted, agreed deviations.
- Acceptance: category-specific limits or other defined metrics, including the treatment of atypical findings.
- Reporting: results, measured area, calibration, photographs and laboratory identification.
- Review: retesting and disposition procedures when results are disputed or a service failure occurs.
Open the printable inclusion-report checklist ↗
Return to the original hardness result with a more complete set of questions. The bar's matrix condition, surface condition and inclusion population each need appropriate evidence. Bringing them together gives the buyer a specification that explains what will be tested and how the steel will be accepted.
Frequently asked questions
Can a steel bar pass a hardness test and still have an inclusion problem?
Yes. A hardness measurement describes indentation resistance at its test location. Inclusion assessment examines a different feature of the steel. A particle at a highly stressed position may matter to fatigue even when the measured matrix hardness meets the order. Specify the two requirements separately where both are relevant.
Does quenching and tempering remove non-metallic inclusions?
Quenching and tempering primarily establish the matrix microstructure and properties. They are not a replacement for steelmaking cleanliness control. Internal oxide inclusions remain a separate inspection concern. Review the heat-treatment evidence and the inclusion evidence together, with each tied to the delivered lot.
Does every dark spot in a micrograph represent an inclusion?
No. Dark features can include etched constituents, cavities, preparation pull-outs or contamination. Start with the specimen preparation and imaging conditions. Examine the feature at sufficient magnification and add chemical analysis when identification matters. Preserve the scale bar and record whether the section was etched.
Is a lower inclusion rating always better for every component?
A rating is meaningful within its method and sampling basis. Component performance also depends on the relevant particle sizes, shapes, positions, matrix condition and loading. Some steels use inclusion control to improve machining. Set the cleanliness requirement for the component's function and compare reports prepared on equivalent terms.
What is the difference between ASTM E45 and ISO 4967?
They are separate standards for assessing non-metallic inclusions in steel, with their own methods and reporting requirements. An order should name the selected standard and edition. ASTM E45-25 and ISO 4967:2026 are the editions referenced here; results should retain the procedure under which they were obtained.
What should I send a laboratory after a grinding rod breaks?
Provide the identifiable fracture pieces, photographs, heat and delivery records, original dimensions, service history and available hardness results. Agree specimen locations and handling with the laboratory before cutting or cleaning the origin. Where available, include retained material from the same lot for comparison.
References and figure credits
Prepared by JOTAIN Materials, 22 September 2026. Research images retain their original panel labels and scale bars; captions identify the source material and test context. The schematic drawings explain geometry and reporting. Questions or corrections can be sent through JOTAIN's contact page, citing the section or figure number.
- Schönbauer, Bernd M.; Ghosh, Sumit; Karr, Ulrike; Pallaspuro, Sakari; Kömi, Jukka; Frondelius, Tero; Mayer, Herwig (2022). Mean-stress sensitivity of an ultrahigh-strength steel under uniaxial and torsional high and very high cycle fatigue loading. Fatigue & Fracture of Engineering Materials & Structures 45(11).
- Zhang, Lifeng; Thomas, Brian G. (2003). State of the Art in Evaluation and Control of Steel Cleanliness. ISIJ International 43(3), 271–291.
- Qiao, Tong; Cheng, Guoguang; Huang, Yu; Li, Yao; Zhang, Yanling; Li, Zhanchun (2022). Formation and Removal Mechanism of Nonmetallic Inclusions in 42CrMo4 Steel during the Steelmaking Process. Metals 12(9), 1505.
- Ånmark, Niclas; Karasev, Andrey; Jönsson, Pär Göran (2015). The Effect of Different Non-Metallic Inclusions on the Machinability of Steels. Materials 8(2).
- Liu, Lu; Ma, Yifan; Liu, Shisen; Wang, Shengnan; Eriksson, Robert (2021). The Fatigue Behaviors of a Medium-Carbon Pearlitic Wheel-Steel with Elongated Sulfides in High-Cycle and Very-High-Cycle Regimes. Materials 14(15), 4318.
- Gu, Chao; Wang, Min; Bao, Yanping; Wang, Fuming; Lian, Junhe (2019). Quantitative Analysis of Inclusion Engineering on the Fatigue Property Improvement of Bearing Steel. Metals 9(4), 476.
- Bruce, T.; Long, H.; Dwyer-Joyce, R. S. (2018). Threshold Maps for Inclusion-Initiated Micro-Cracks and White Etching Areas in Bearing Steel: The Role of Impact Loading and Surface Sliding. Tribology Letters 66, 111.
- Li, Dongling; Wang, Haizhou; Shen, Xuejing; Lin, Shuangping; Feng, Haozhou; Peng, Ya; Jiang, Fan; Zhou, Xuefan (2022). Quantitative Distribution Characterization and Correlation Study of Composition, Structure and Hardness of Rim Region in Railway Wheel. Materials 15(14), 4762.
- Ramesh Babu, Shashank; Michelic, Susanne Katharina (2022). Analysis of Non-Metallic Inclusions by Means of Chemical and Electrolytic Extraction—A Review. Materials 15(9), 3367.
- Evident Scientific. Nonmetallic Inclusion Analysis in Steel. Microscopy application guidance.
- Struers. Metallographic grinding and polishing: preparation goals, pull-outs, relief and contamination.
- ASTM International (2025). ASTM E45-25 — Standard Test Methods for Determining the Inclusion Content of Steel.
- International Organization for Standardization (2026). ISO 4967:2026 — Steel: Determination of the non-metallic inclusion content — Micrographic method. Fourth edition, May 2026.
- ASTM International (2023 reapproval). ASTM E1245-03(2023) — Standard Practice for Determining the Inclusion or Second-Phase Constituent Content of Metals by Automatic Image Analysis.
- ASTM International (2019 reapproval). ASTM E2283-08(2019) — Standard Practice for Extreme Value Analysis of Nonmetallic Inclusions in Steel and Other Microstructural Features.