
SEGREGATION / MICROSTRUCTURE / STEEL BAR QUALITY
Segregation and Banding in Steel Bars: Why Properties Vary Within One Bar
Follow the chemical pattern from the cast billet to the finished bar—and learn what the bands mean for inspection and service in grinding rods and shaft stock.
A steel bar can satisfy its specified chemical composition and still contain regions that respond differently to heat treatment. Segregation is a spatial variation in chemical composition; banding is an aligned pattern in the microstructure. The two are often connected. Chemical differences inherited from solidification can be stretched during rolling, then expressed as bands of ferrite and pearlite, or as regions with different proportions of bainite and martensite. 1, 2
For a buyer reviewing a certificate, or an engineer examining a worn grinding rod or fractured shaft, the useful questions are quite specific. Where was the specimen taken? Which way was it cut? What are the bands made of? Do they coincide with differences in chemistry, hardness or fracture behavior? A photograph becomes engineering evidence when those questions can be answered.
Select an image to examine it at full size ↗
1. Segregation and banding in steel bars
The chemistry reported for a heat describes the analyzed sample. It does not provide a map of every location within every bar. During solidification, the growing solid and the remaining liquid generally contain different concentrations of alloying elements. As solidification proceeds, enriched and depleted regions develop. Subsequent processing determines how much of that variation remains and how it is distributed. 1
It helps to keep three scales separate. Microsegregation concerns composition differences associated with the solidification structure, such as the regions between dendrite arms. Macrosegregation concerns larger regions within a casting or product, including center segregation. Microstructural banding describes the arrangement visible after metallographic preparation. A large segregated region can itself contain many smaller bands.
| Observation | What is being described? | Useful examination |
|---|---|---|
| Chemical segregation | Local enrichment or depletion of an element | Composition measurements tied to a defined position; element maps or line scans |
| Ferrite–pearlite banding | Alternating regions with different proportions of ferrite and pearlite | Etched longitudinal sections, optical microscopy and higher-magnification examination |
| Martensite/bainite banding | Aligned regions with different transformation products | Microscopy supported by chemistry and local hardness |
| Inclusion stringers | An aligned distribution of non-metallic particles | Examination of the polished surface, followed by particle identification where needed |
| A surface layer with reduced carbon | Decarburization extending inward from an exposed surface | A section retaining the original surface, with metallography and a suitable hardness traverse |
These observations can coexist. A segregated region may also contain inclusions, and a bar with internal banding may have a decarburized surface. Keeping the descriptions separate prevents one test result from being used to answer several different questions. The companion guides on non-metallic inclusions and decarburization examine those mechanisms in detail.
2. How casting, rolling and cooling produce bands
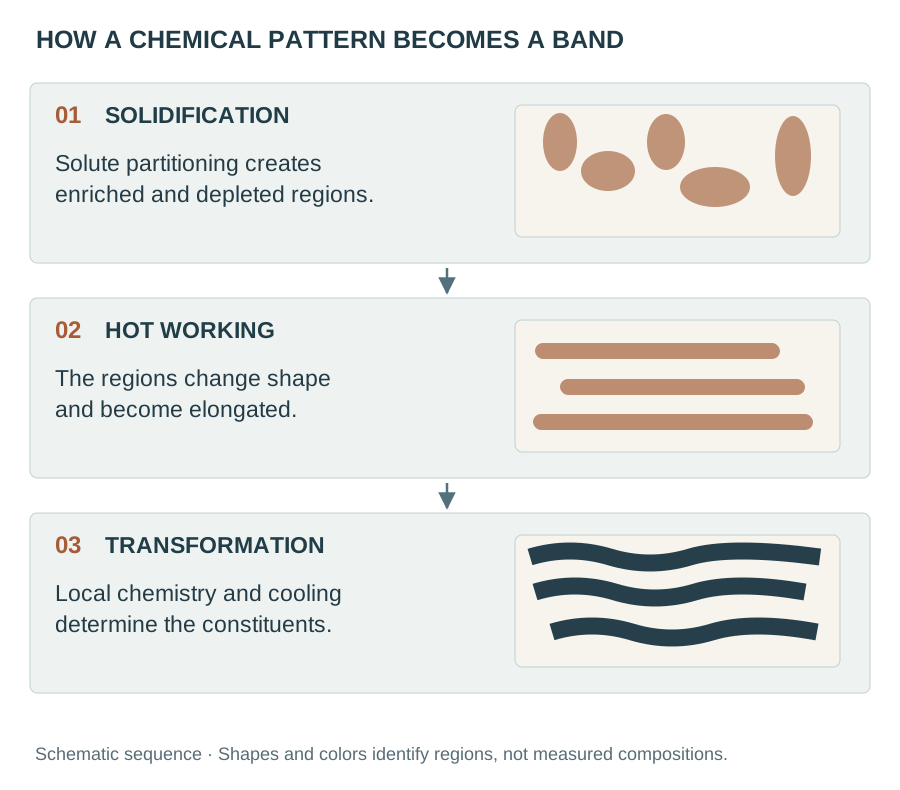
The sequence begins before the bar reaches the rolling mill. In the liquid–solid region of a casting, solute partitioning creates local differences in composition. Movement of enriched liquid and the way the last liquid solidifies can also produce larger segregation patterns. Rolling then changes the shape and spacing of those regions. Material that occupied a compact region of the billet may become a long, narrow region in the finished product. 1
Cooling gives that chemical pattern a microstructural expression. In a low-alloy ferrite–pearlite steel, manganese-rich and manganese-poor regions can begin transforming at different temperatures. Ferrite formation also redistributes carbon into the remaining austenite. The eventual ferrite and pearlite distribution therefore reflects both the inherited alloy distribution and the transformation sequence. 2
Select an image to examine it at full size ↗
Rolling reduction can alter the dimensions and continuity of a segregated region without making its composition uniform. There is a useful physical distinction here: closing a cavity brings two internal surfaces together; homogenizing a chemical difference requires atoms to diffuse over a distance. Evidence that rolling has closed porosity does not establish that segregation has disappeared.
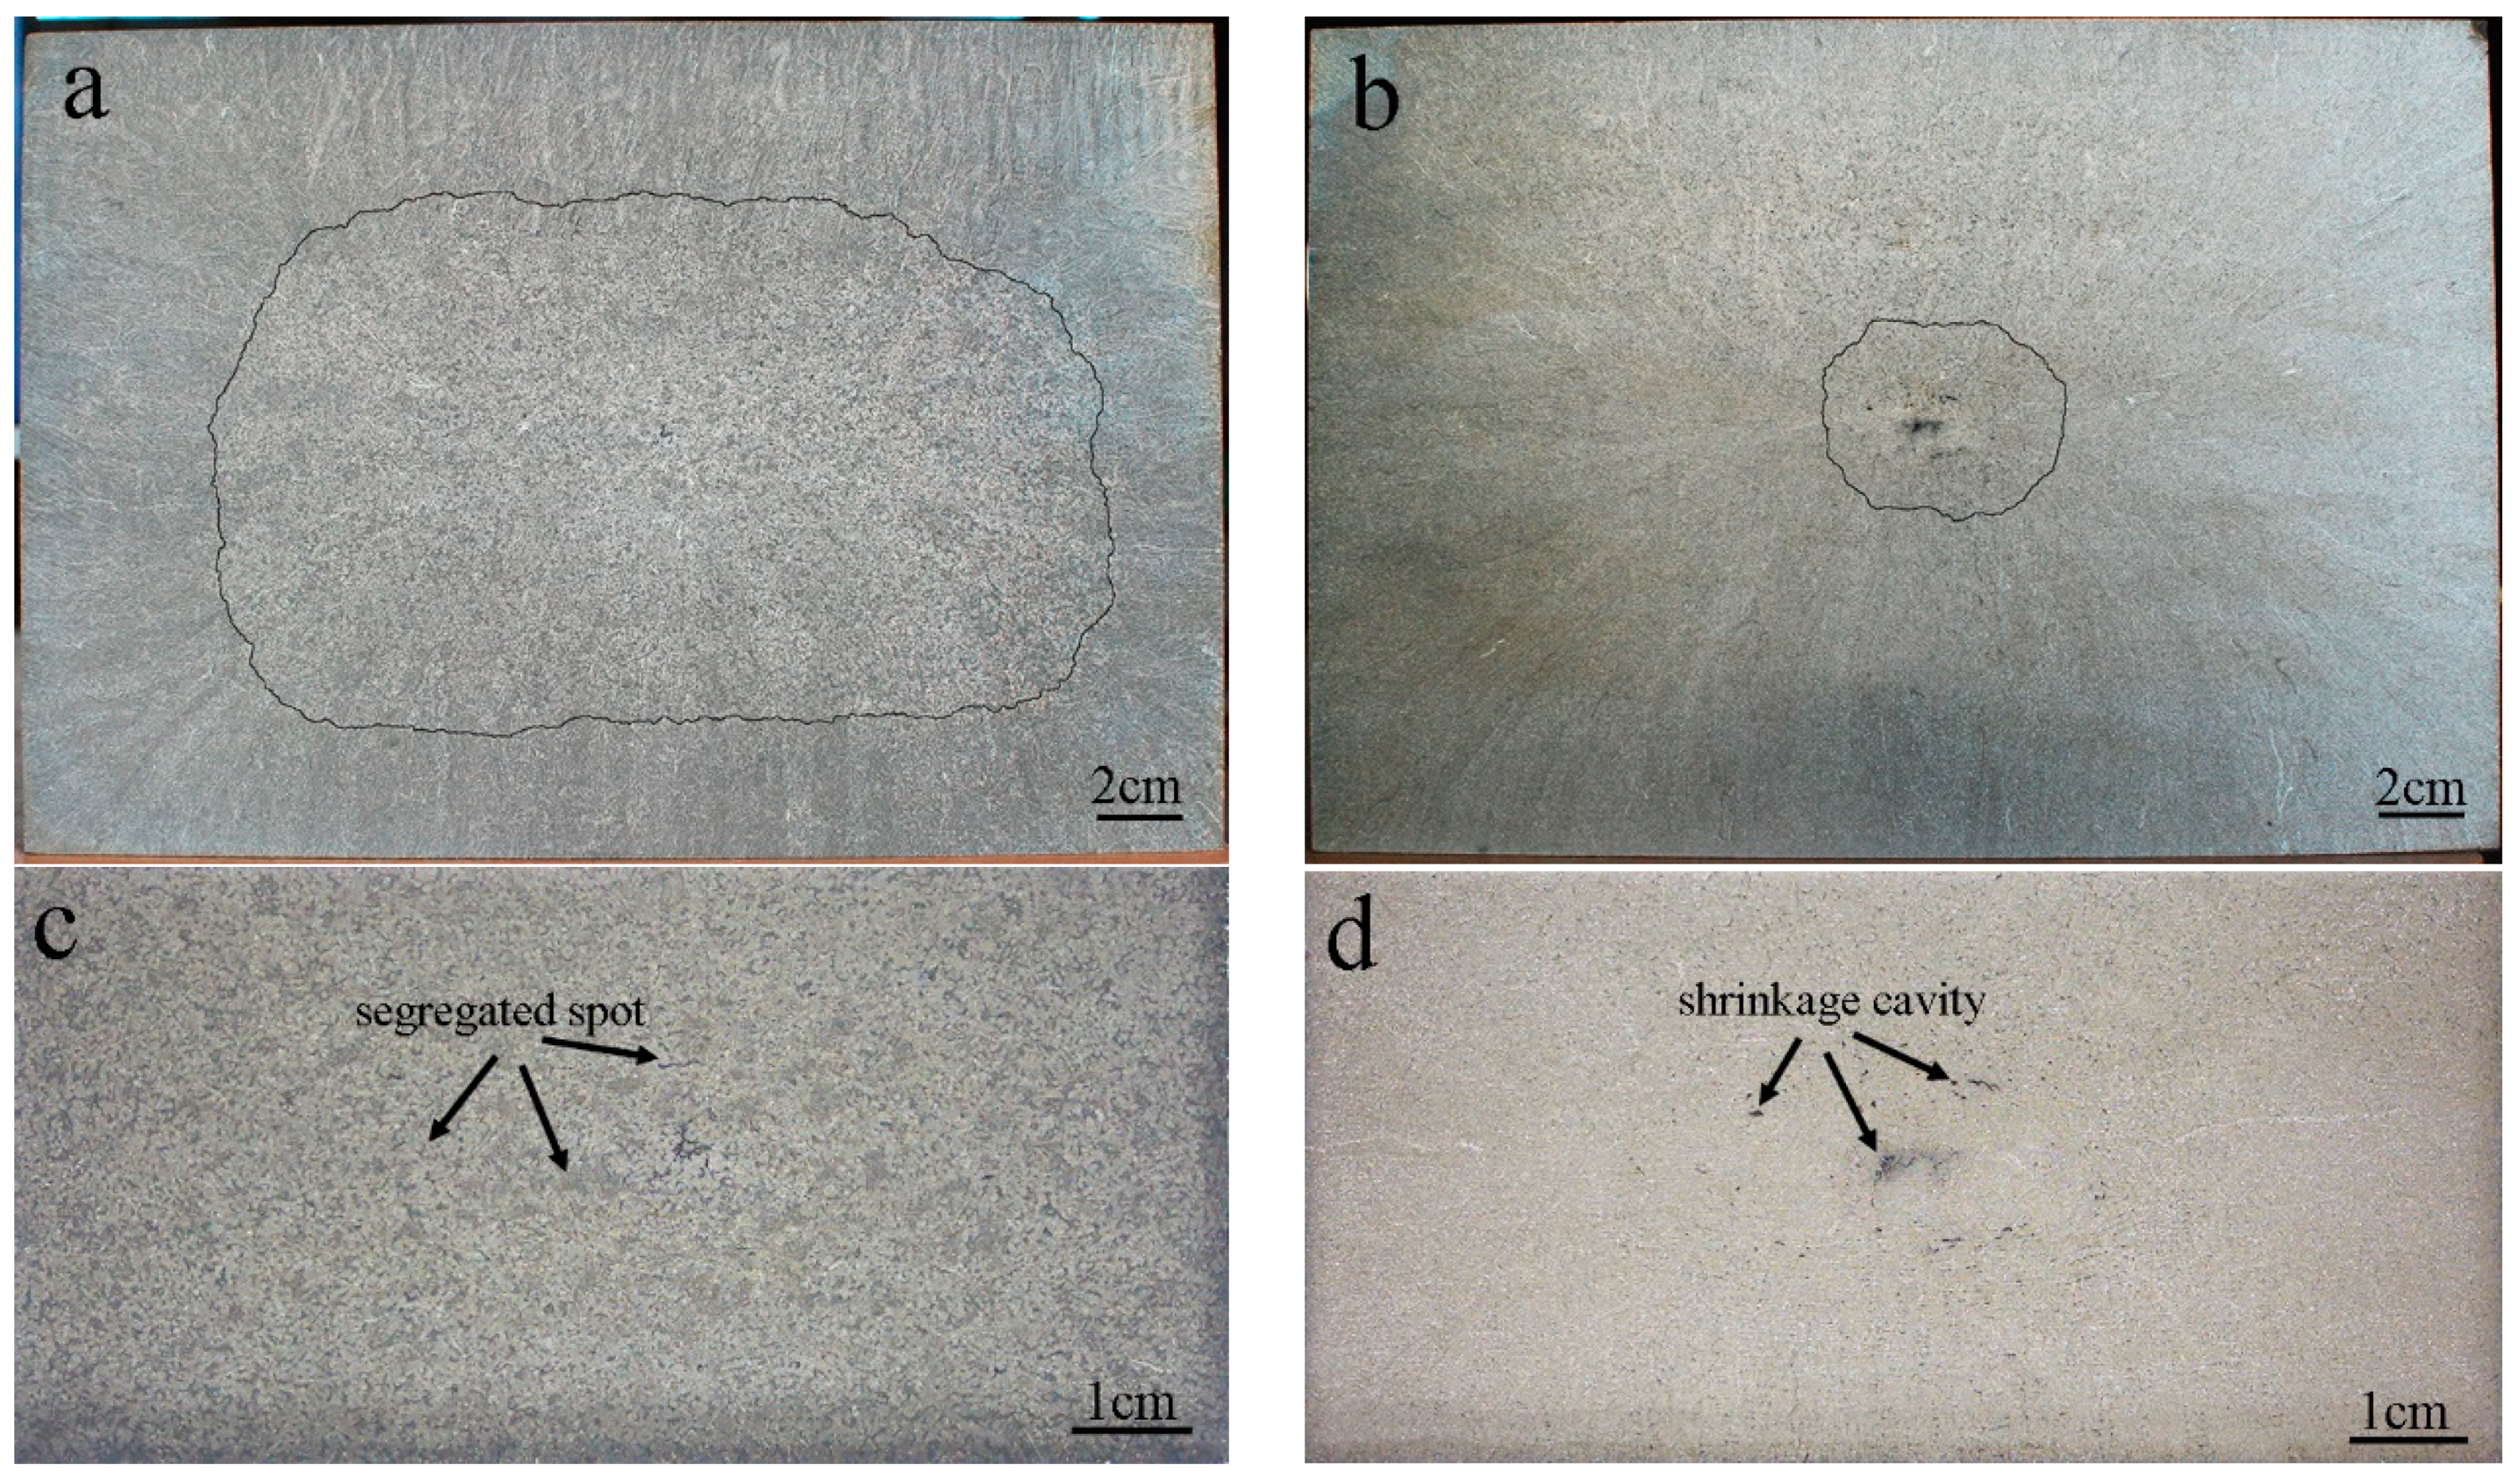
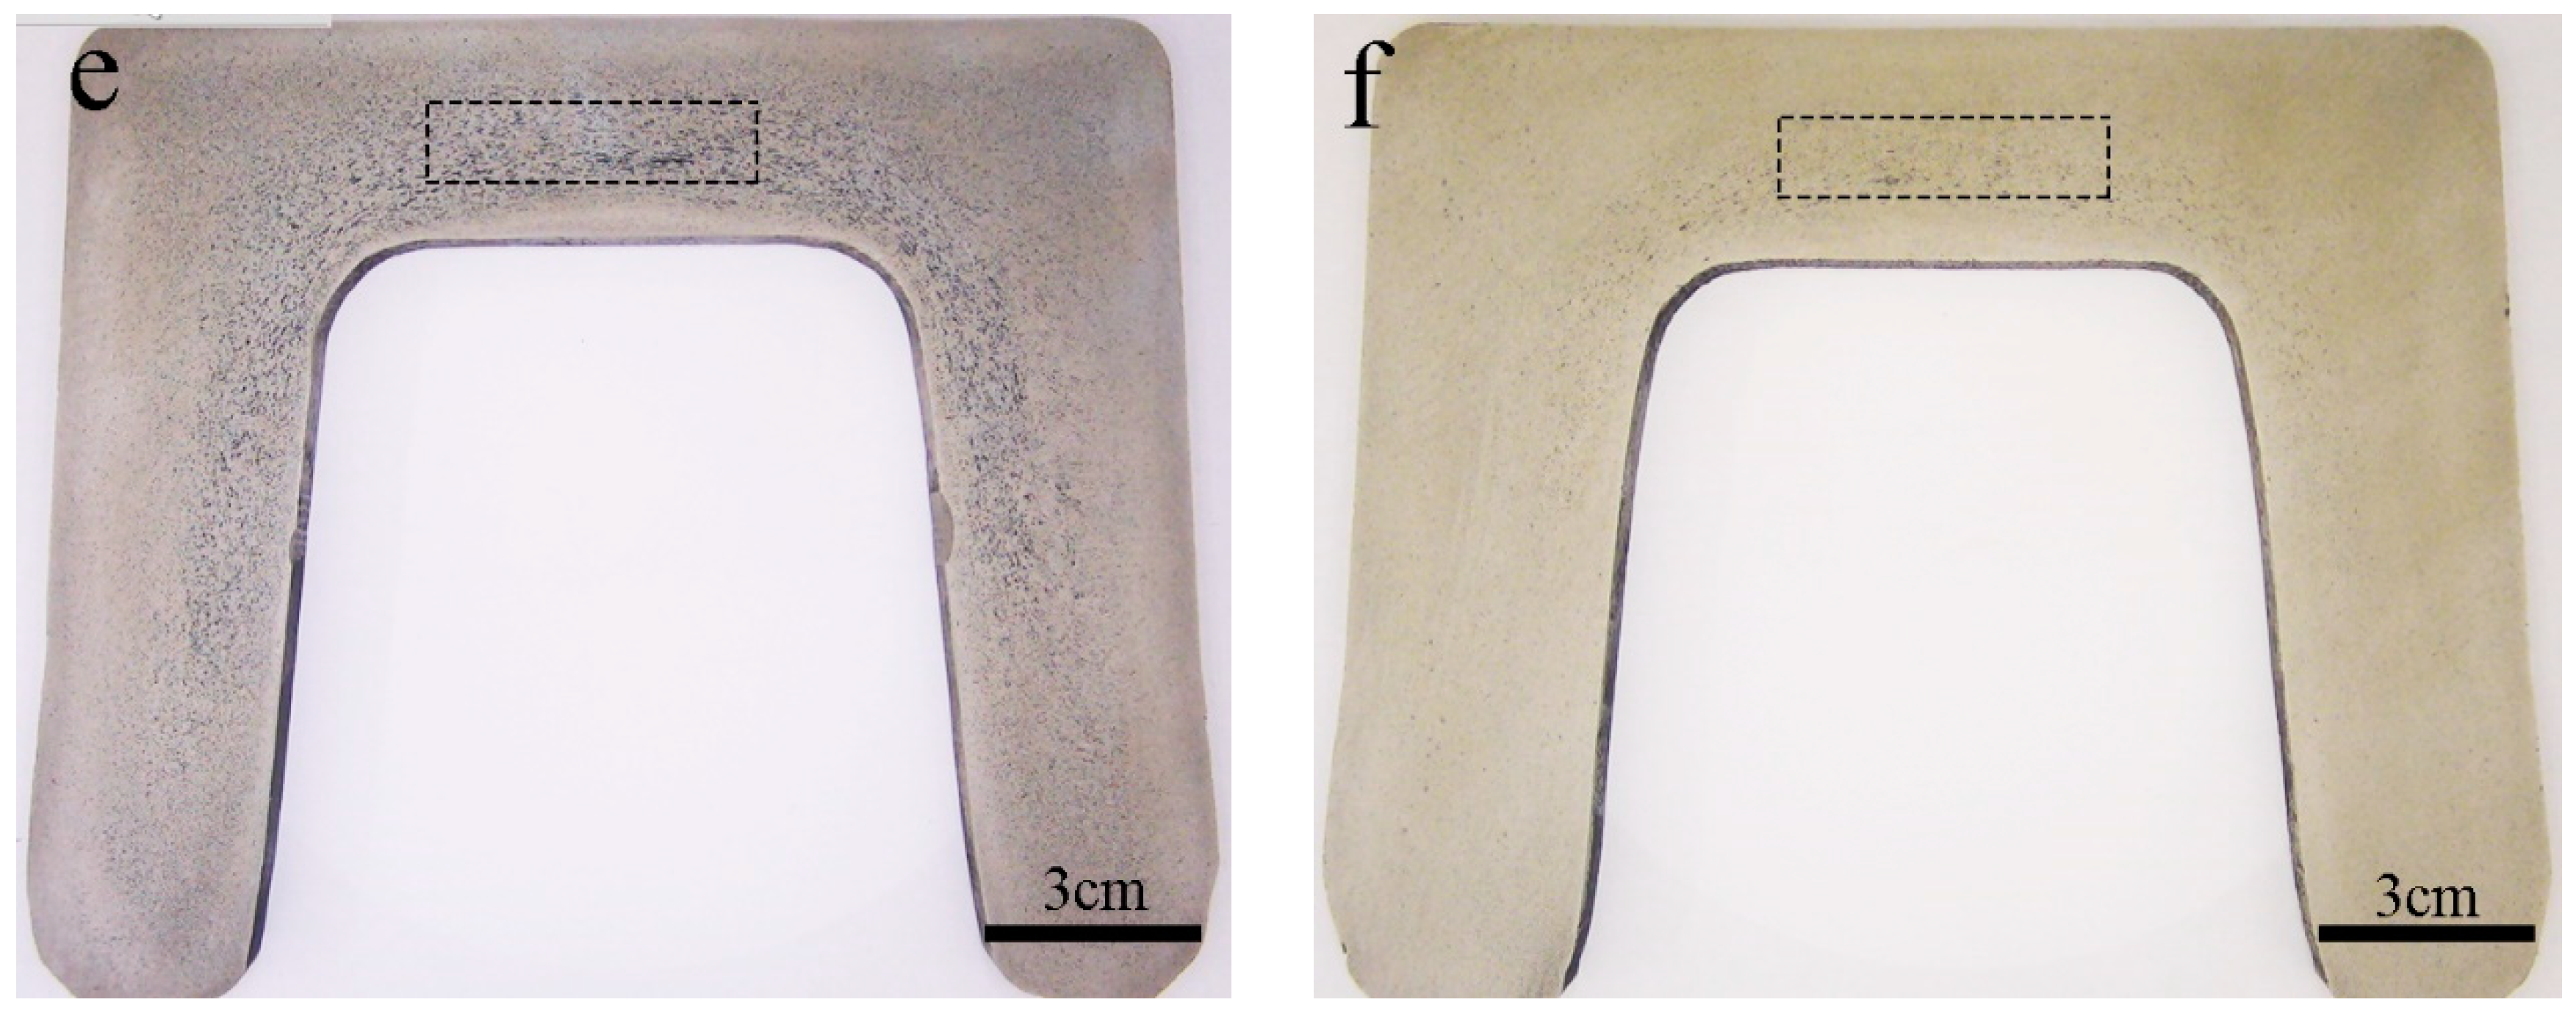
Guo and colleagues followed two continuously cast billets into U-section steel using the same subsequent rolling process. The starting billets measured 280 × 380 mm in cross-section. Their nominal composition included 0.15% C and 1.5% Mn, by mass. The macrographs show how different central regions in the billets were carried into the rolled sections. This is a study of structural sections, and the actual geometry is retained in the photographs. 1
Select an image to examine it at full size ↗
Look first at the scale bars. The upper images cover centimeters, not individual grains. The lower section views then locate the material selected for closer examination. This connection between an overview and a sampling location is what makes the later micrographs interpretable.
3. Read the chemistry beside the micrograph
An etched image shows how the prepared surface responds to the etchant and the imaging method. Dark contrast alone does not identify manganese, carbon or a particular transformation product. To establish chemical segregation, compare the structure with measurements from the same area.
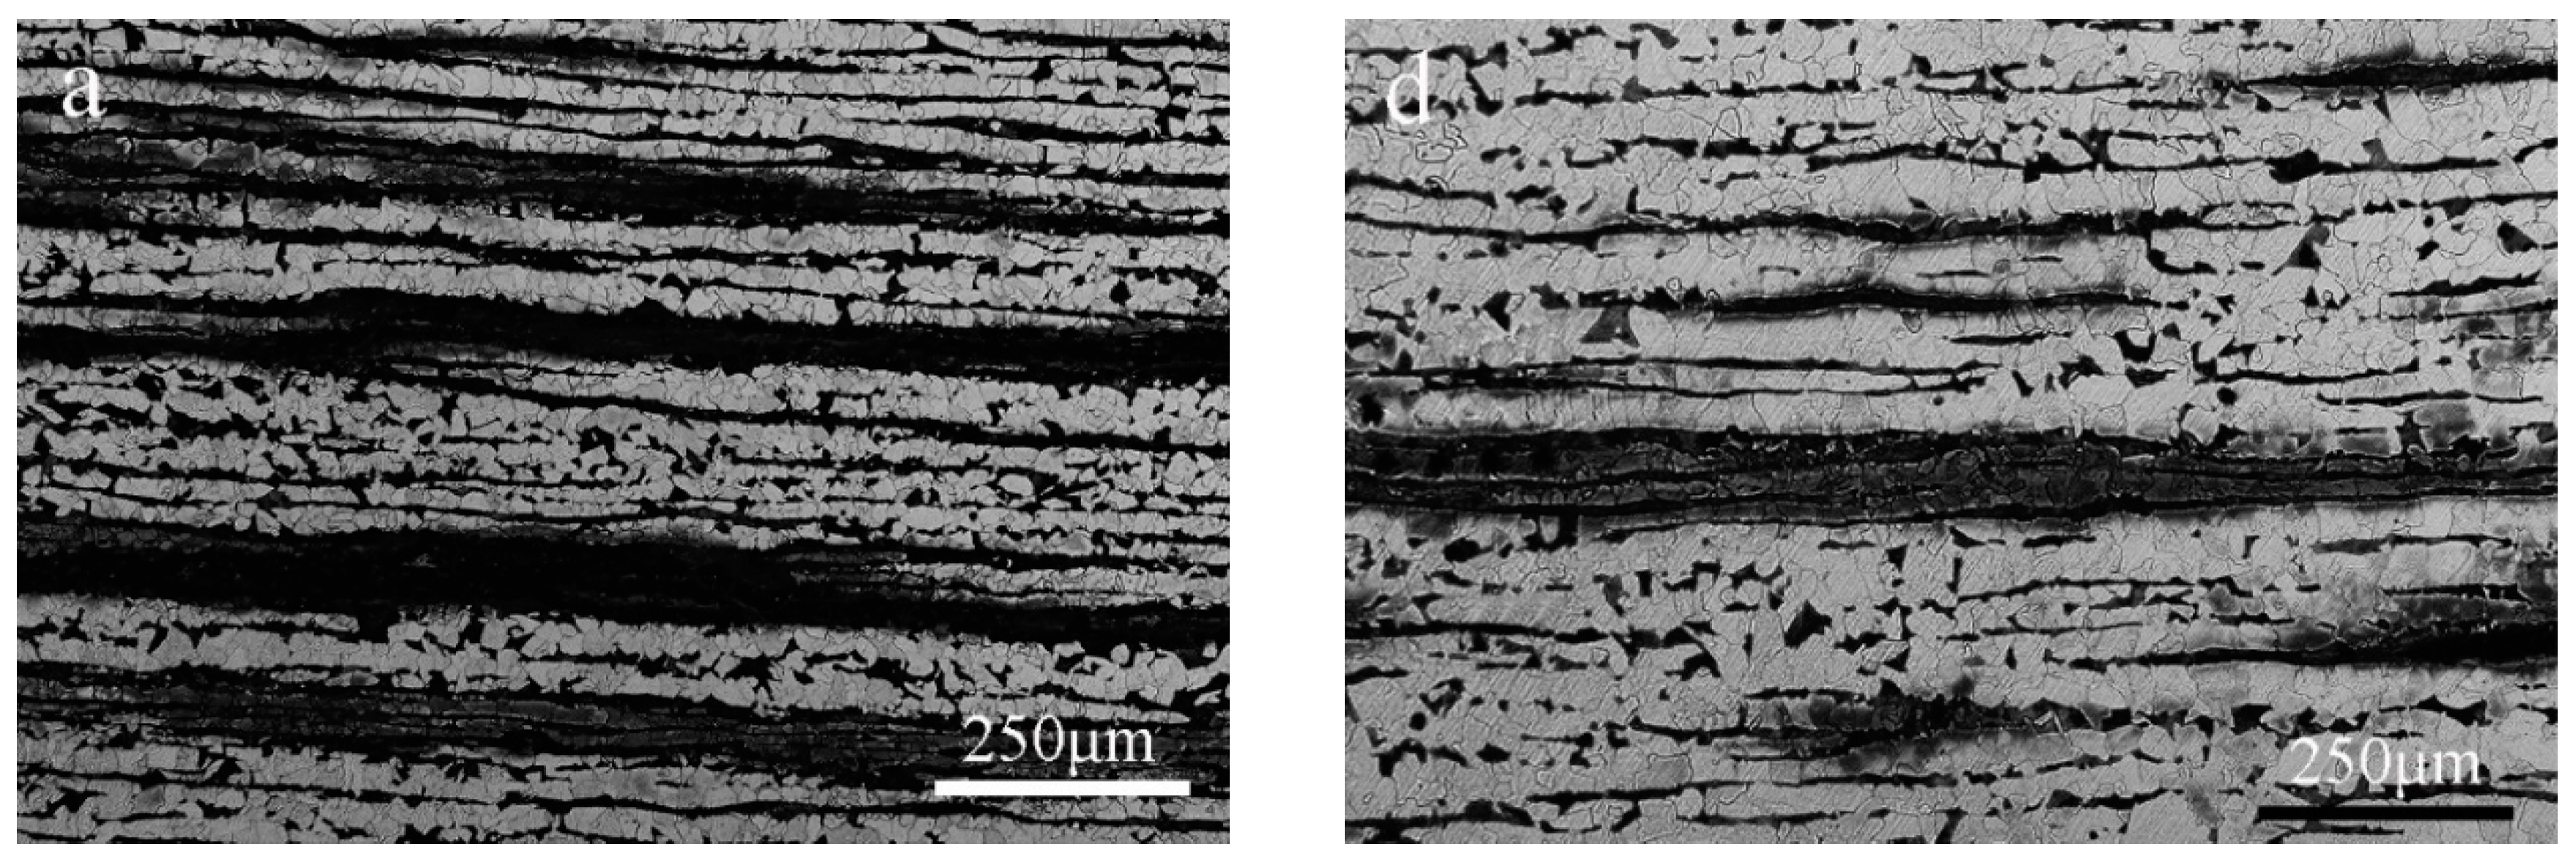
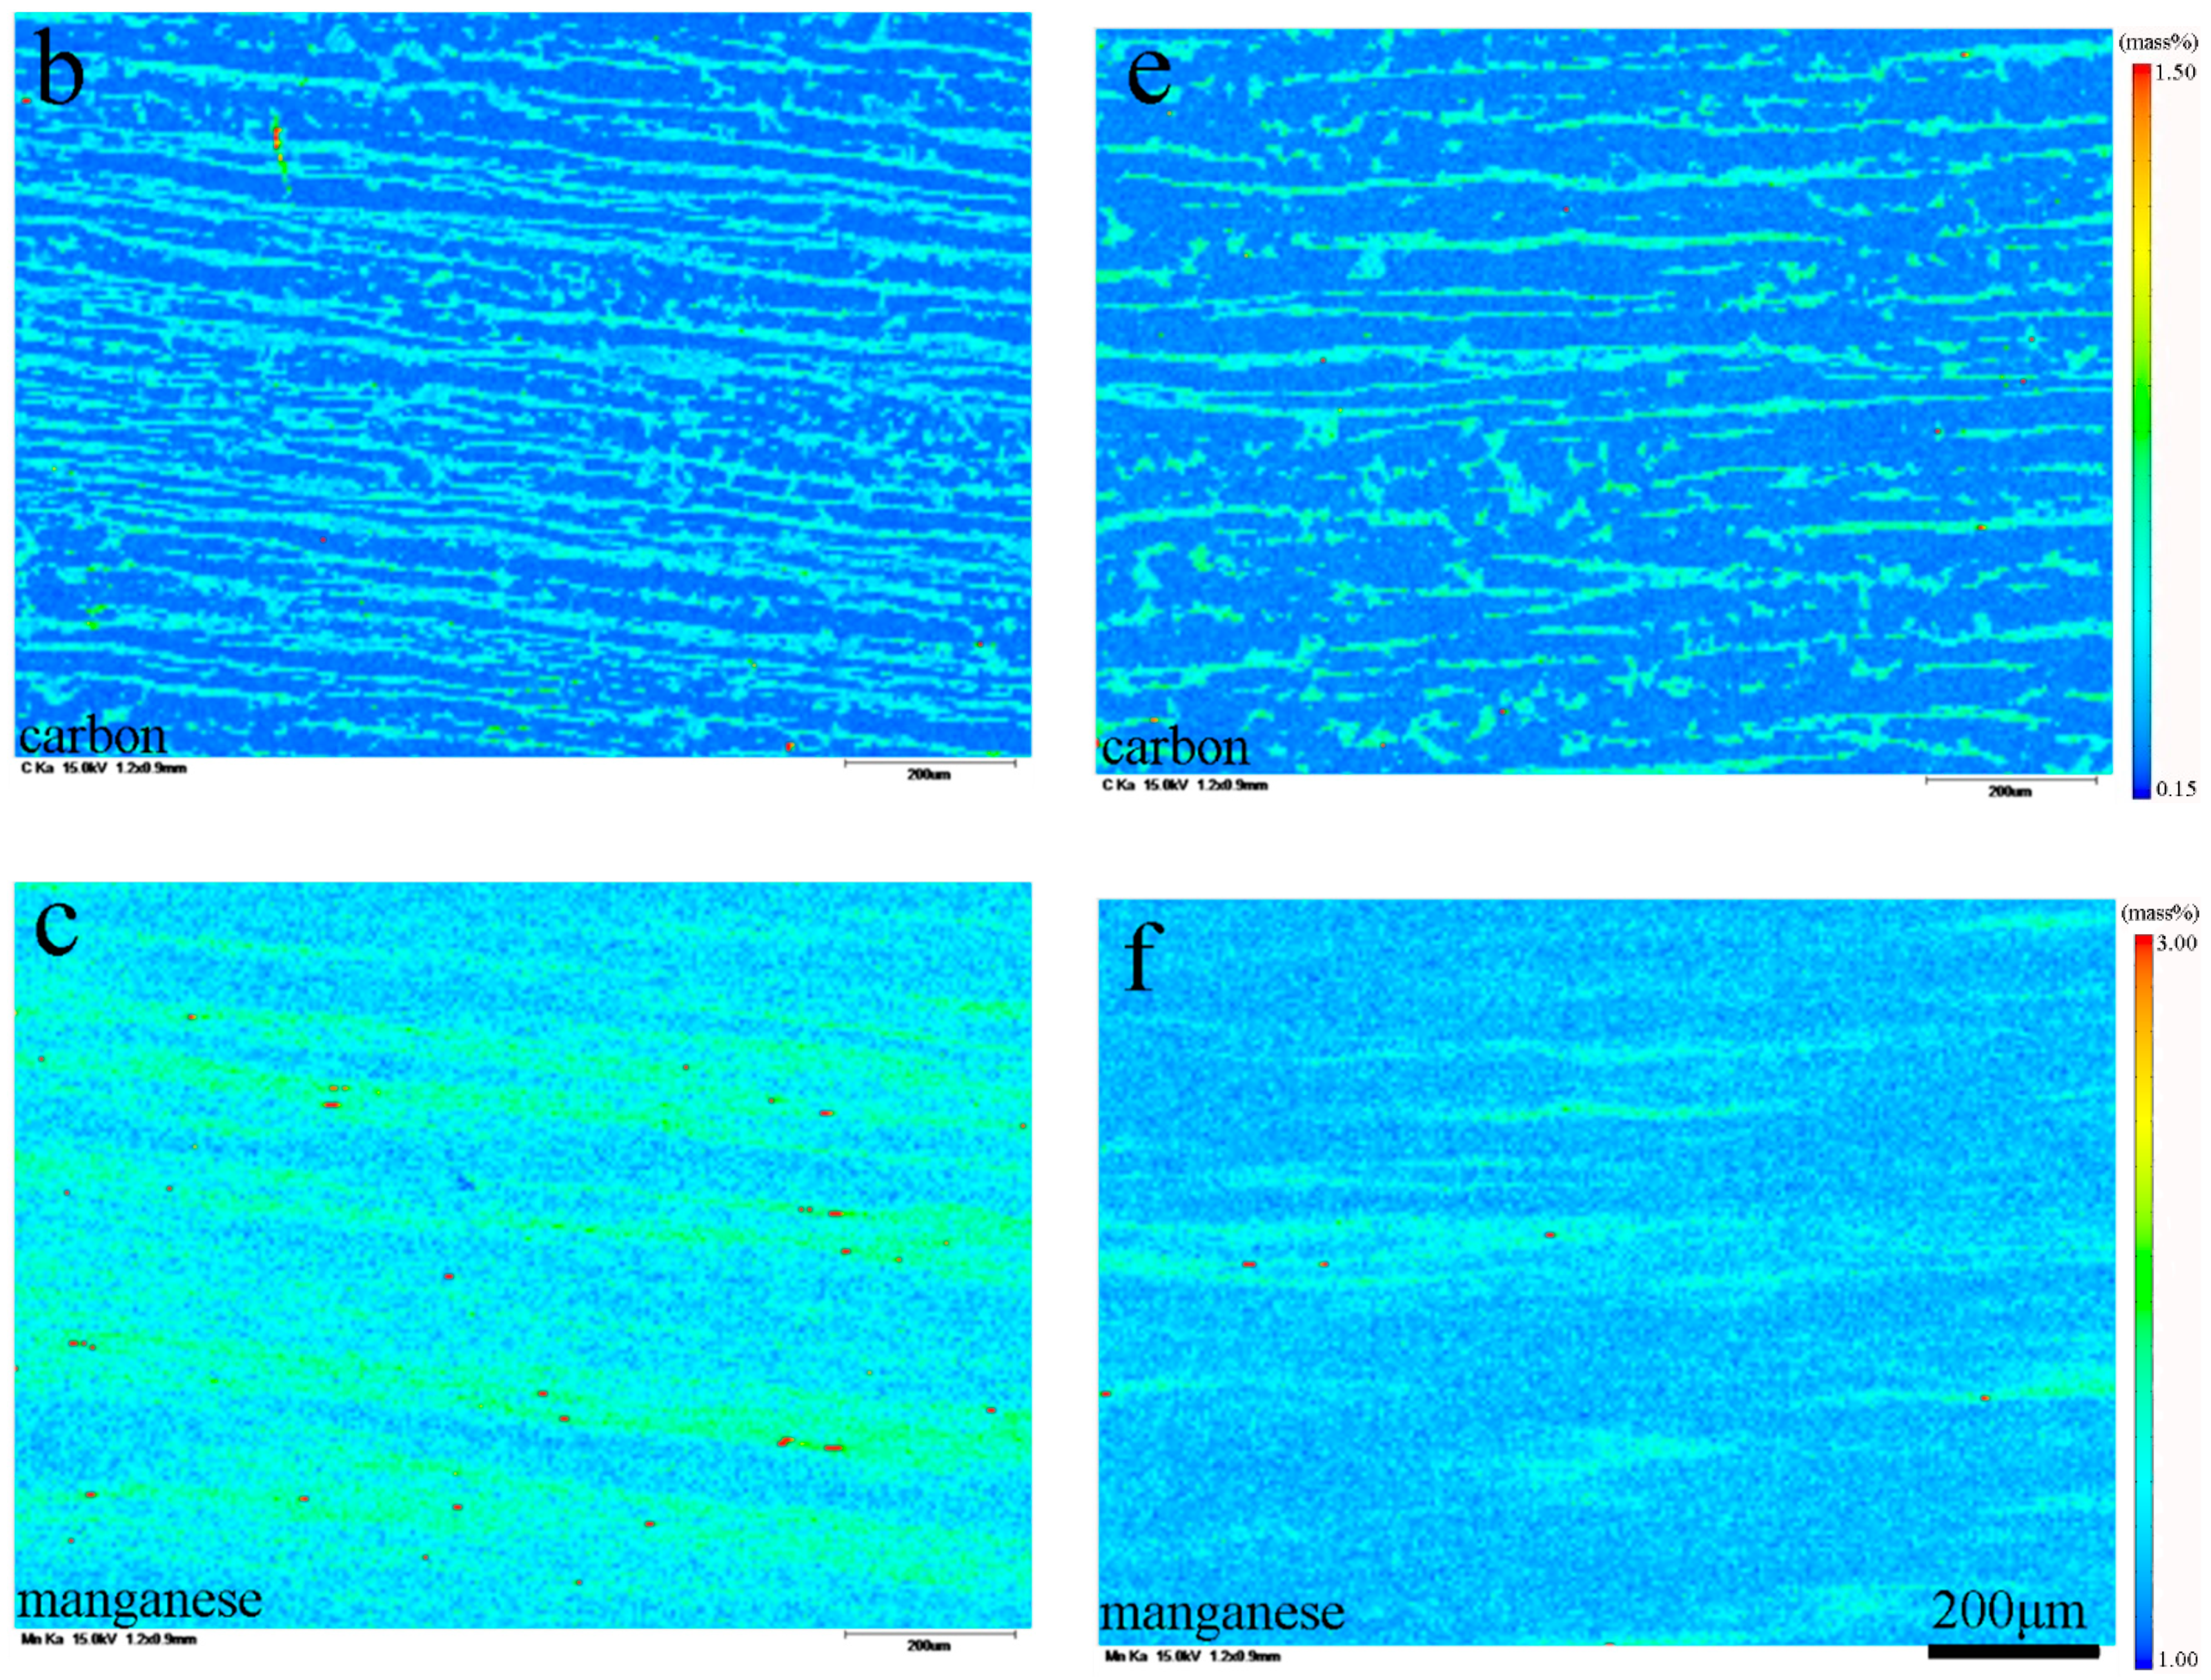
In Guo's rolled sections, electron probe microanalysis, or EPMA, linked the dark bands to manganese enrichment. The carbon maps also followed the pearlitic regions. Both observations matter, but they describe different parts of the history: manganese preserves information about inherited chemical variation, while carbon distribution also reflects the transformation into ferrite and pearlite. 1
Select an image to examine it at full size ↗
A color map should be read as a measurement with a legend. Check the element, concentration scale, field dimensions, specimen preparation and spatial resolution. Two red regions from different maps need not represent the same concentration if the color scales differ. Compare the values and the locations, rather than the colors alone.
Select an image to examine it at full size ↗
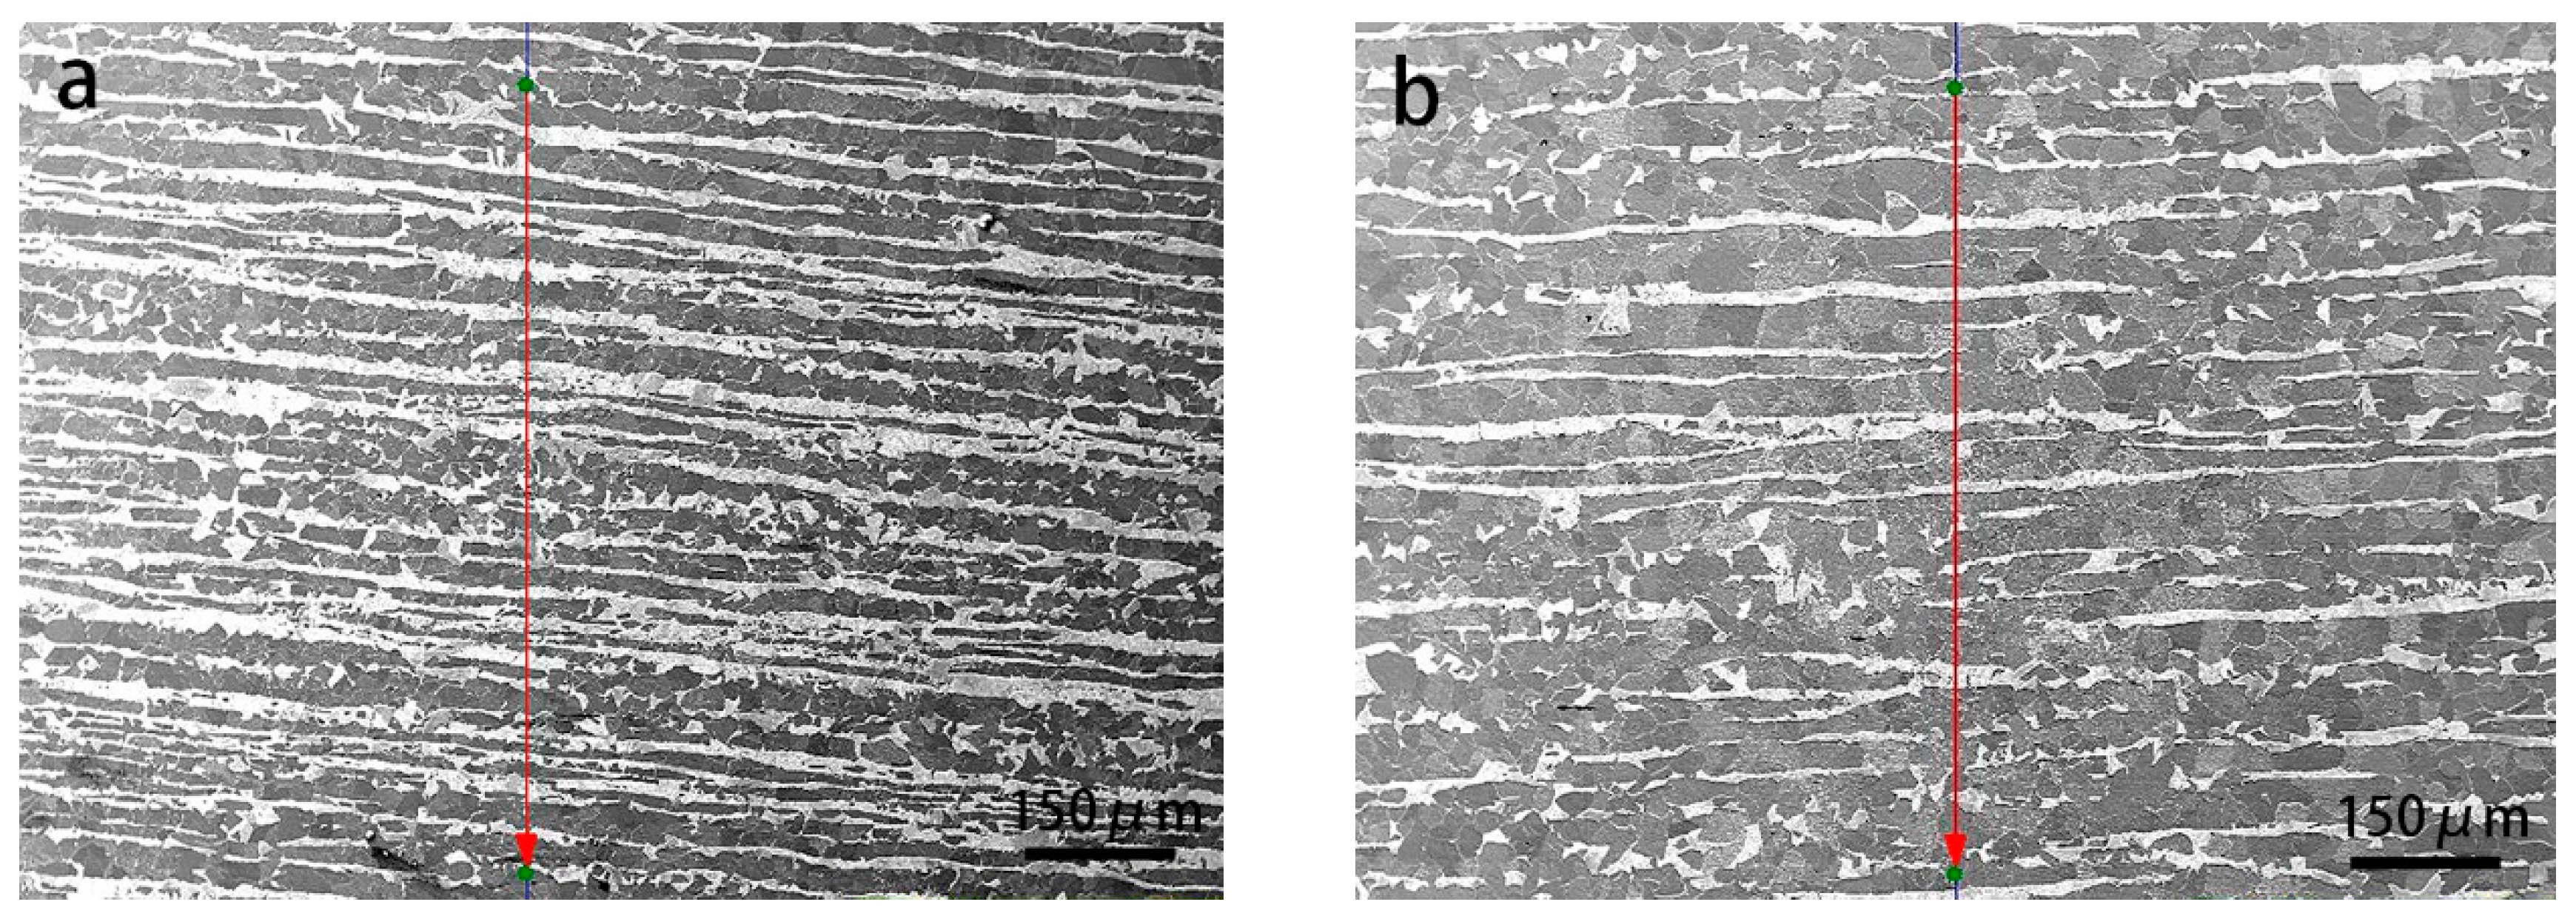
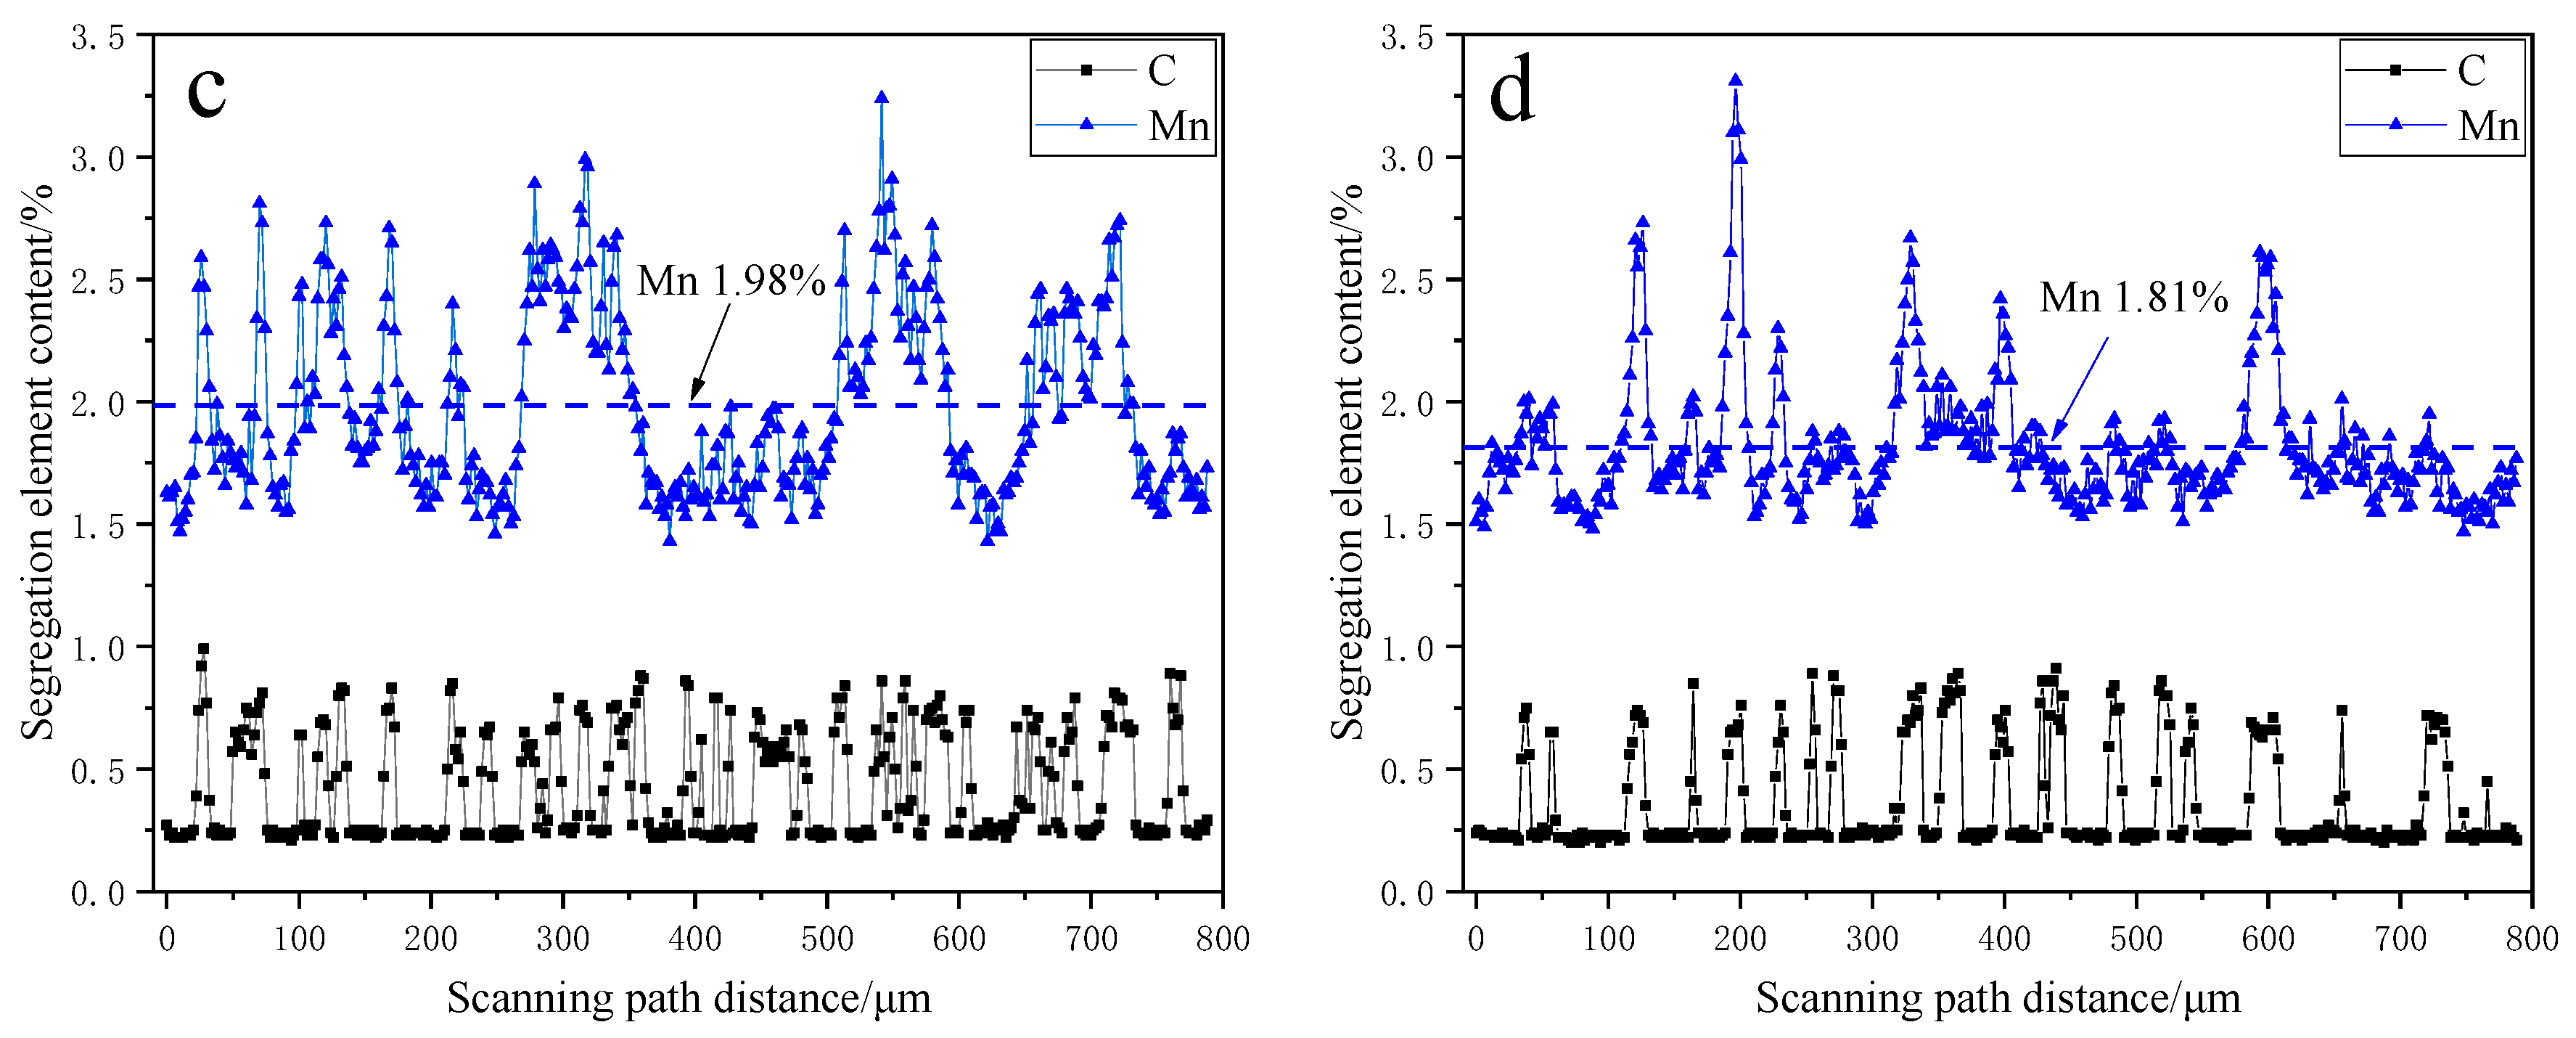
The line scans make the spatial relationship more explicit. A peak has a position along the traverse, and that position can be compared with a particular constituent in the image. In this study, the reported mean manganese contents in the examined segregation regions were 1.98% and 1.81% for Steels 1 and 2. Those are local results from the investigated regions; they are not the nominal chemistry of two unrelated steel grades. 1
Surface preparation deserves attention when interpreting carbon measurements. In their study of 23CrMoNi drill bars, Meng and colleagues found that a carbon pattern observed on an etched surface was absent from the polished-surface map within their measurement capability. Chromium, nickel and molybdenum still showed banded distributions. The example is a good reason to examine how a map was acquired before assigning a chemical meaning to every bright feature. 4
4. What ferrite–pearlite bands reveal
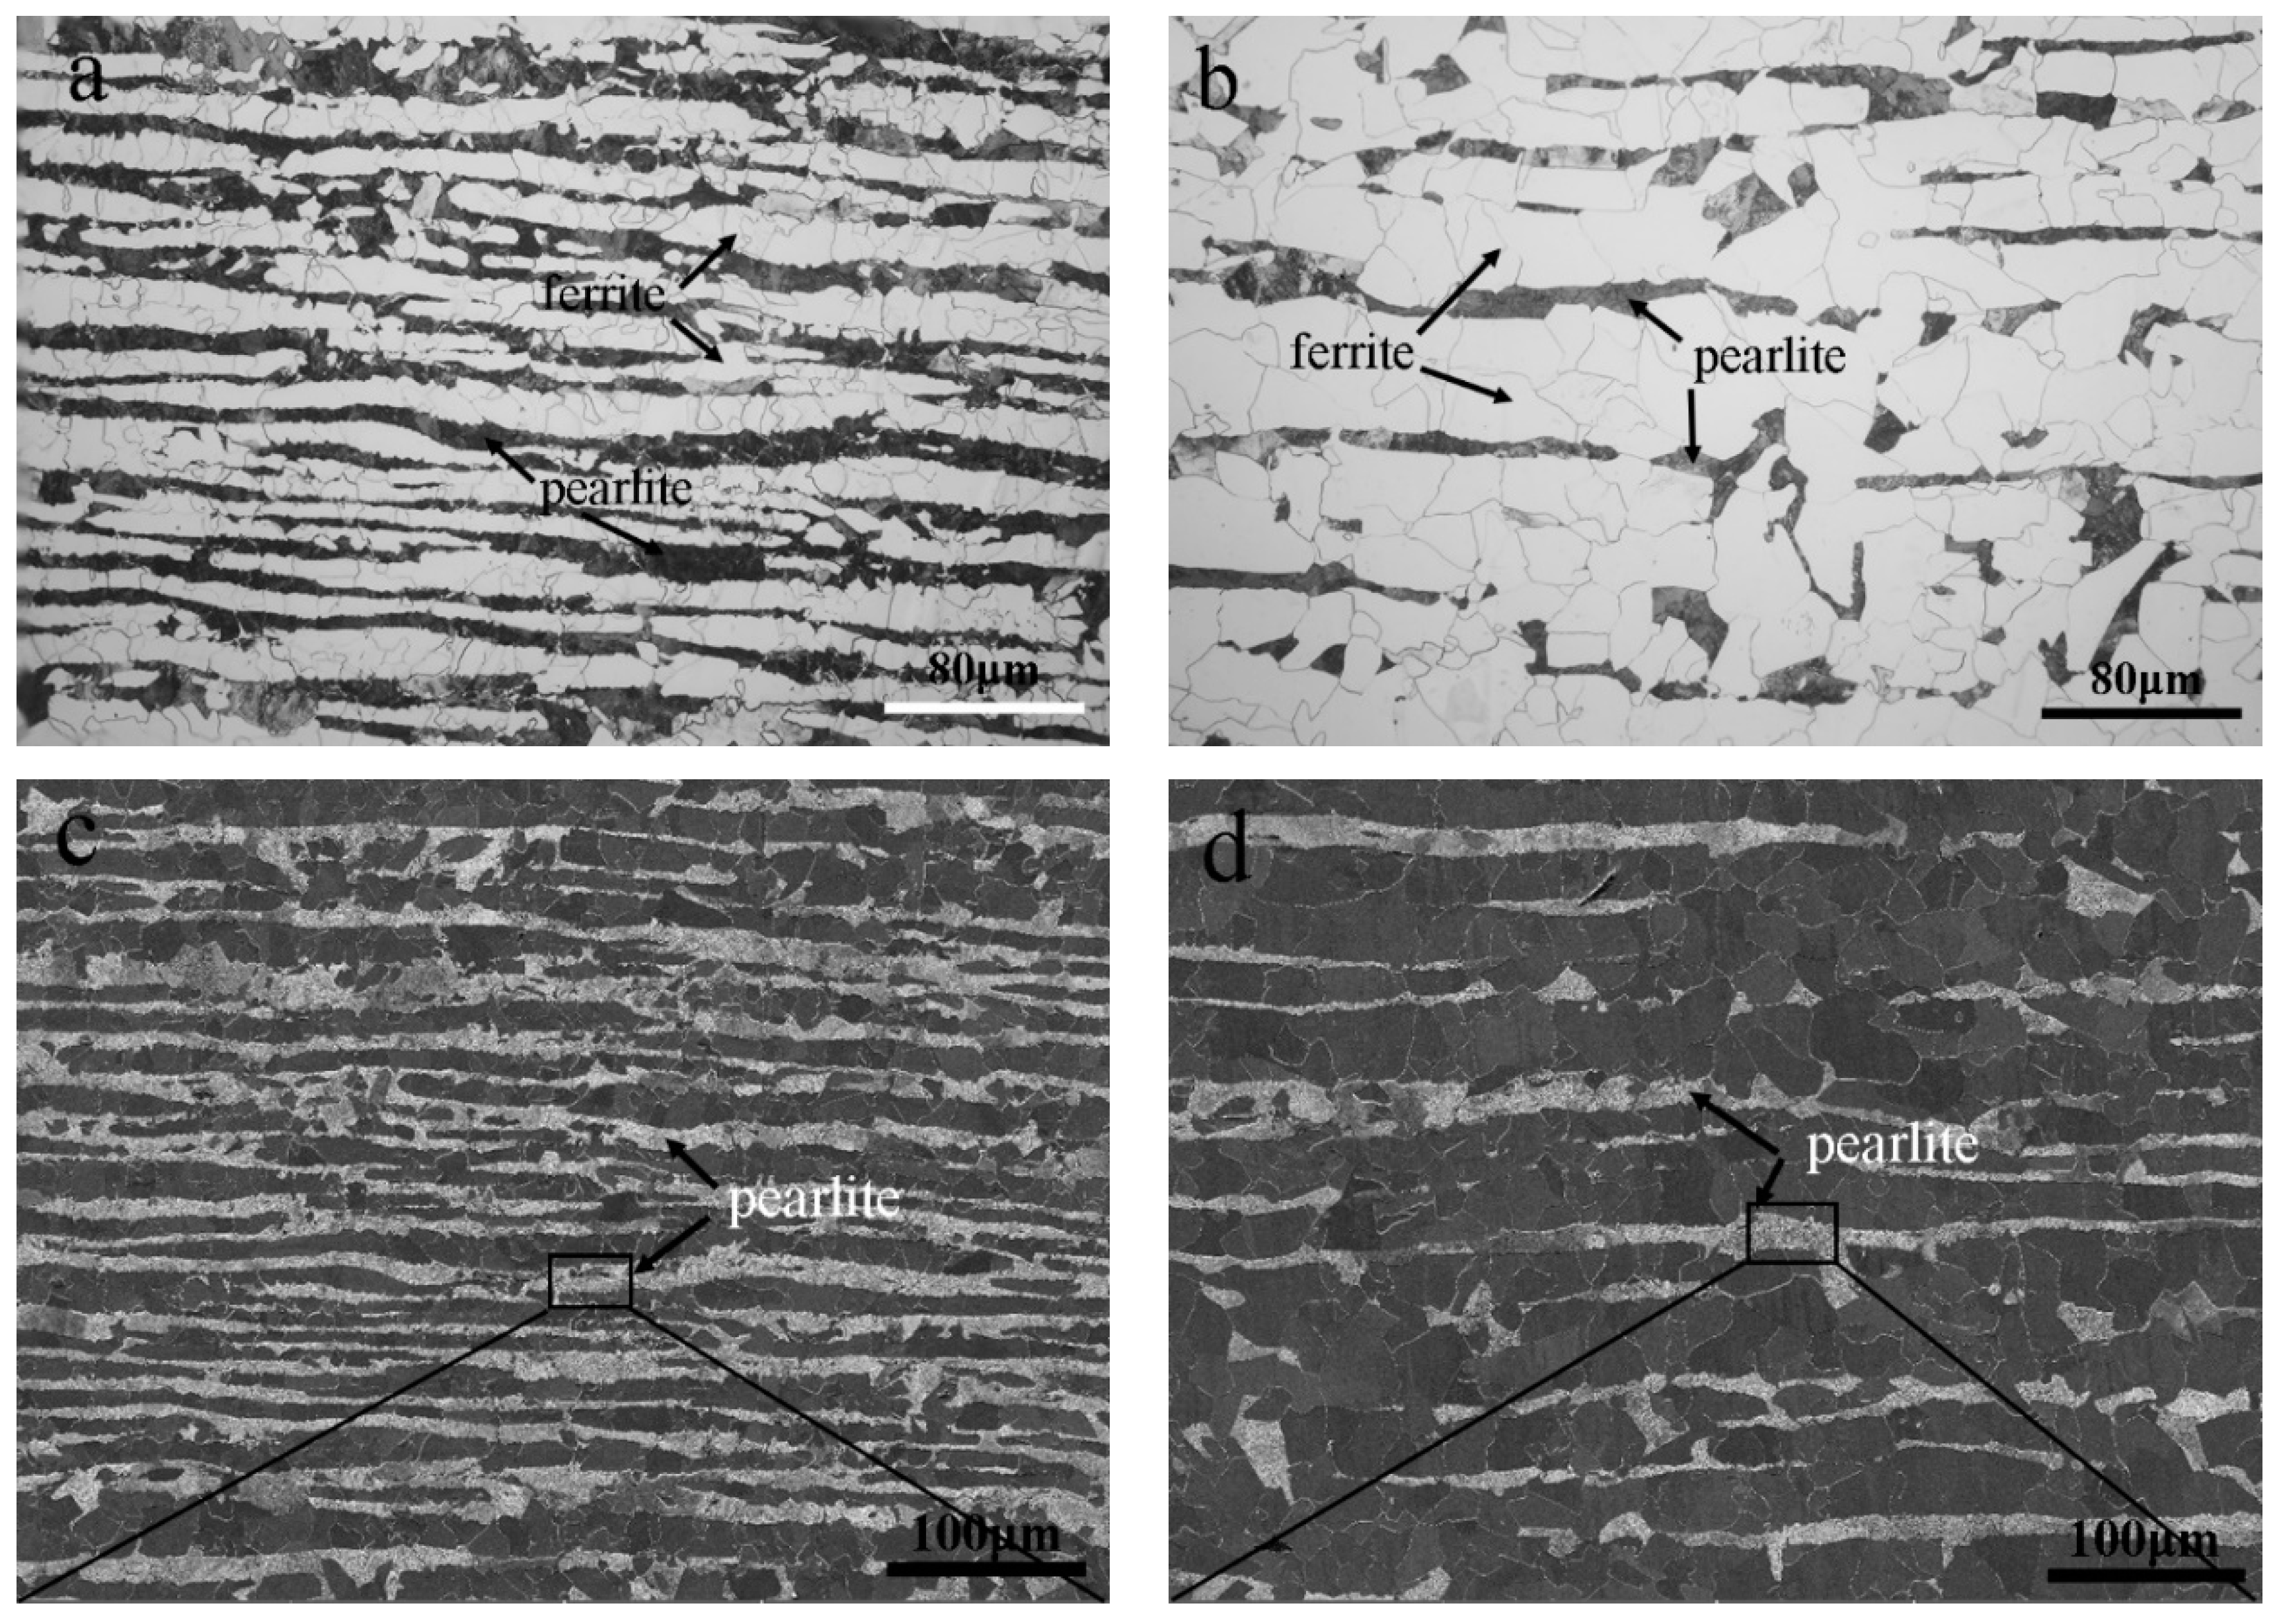
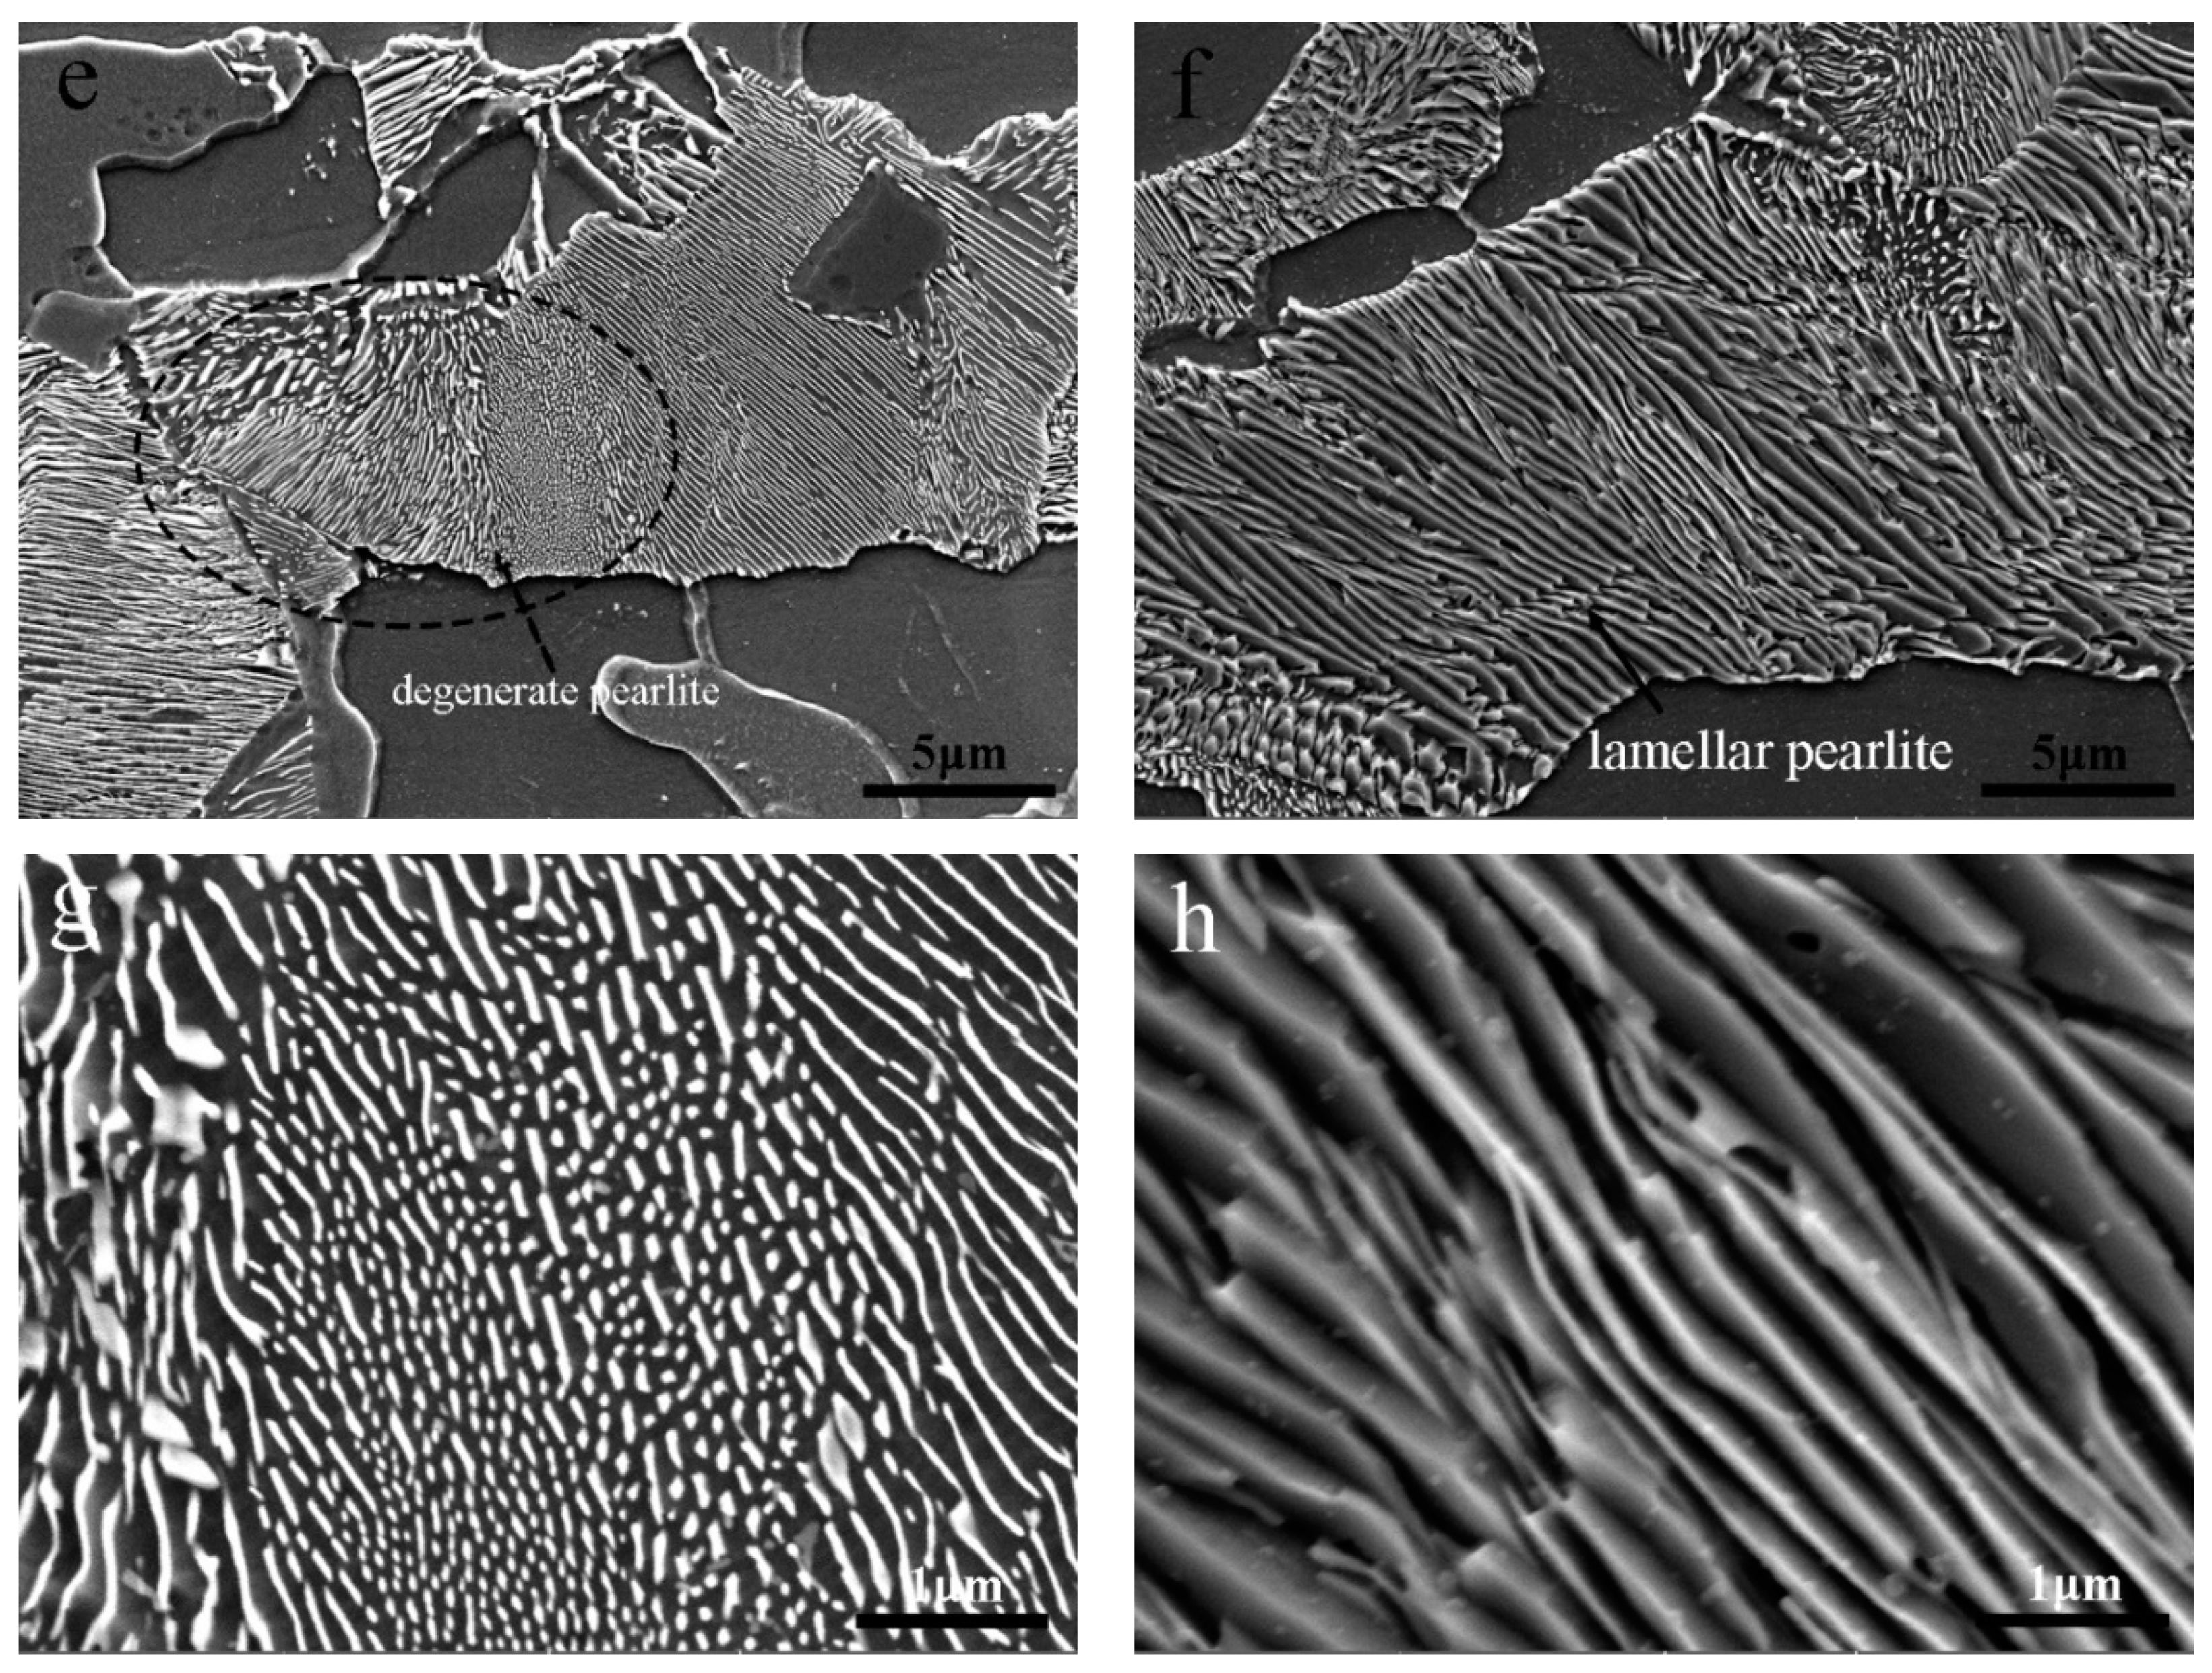
Return to Figure 1. Under the optical conditions used there, ferrite appears light and the pearlitic regions appear dark. At the higher magnification below, the internal morphology of those pearlitic regions becomes visible. The researchers identified degenerate pearlite in Steel 1 and more regular lamellar pearlite in Steel 2. The difference involves the morphology and distribution of the constituents, as well as their alignment. 1
Select an image to examine it at full size ↗
A useful report therefore goes beyond “banding present.” It describes the constituent, continuity, width and spacing of the bands, together with the fraction and distribution of the surrounding structure. It also identifies whether the image represents a typical field or a deliberately selected severe region. A close-up selected to explain a feature cannot by itself describe an entire section.
There is a second reason to record the heat-treatment condition. Visible ferrite banding depends partly on the relationship between the austenite grain size and the spacing of the segregated regions. Kusaka, Araki and Iwamaru demonstrated this relationship experimentally: changing the grain structure changed how clearly the bands developed during subsequent transformation. A change in appearance must therefore be interpreted alongside the treatment history. 9
A recognizable example in 42CrMo4
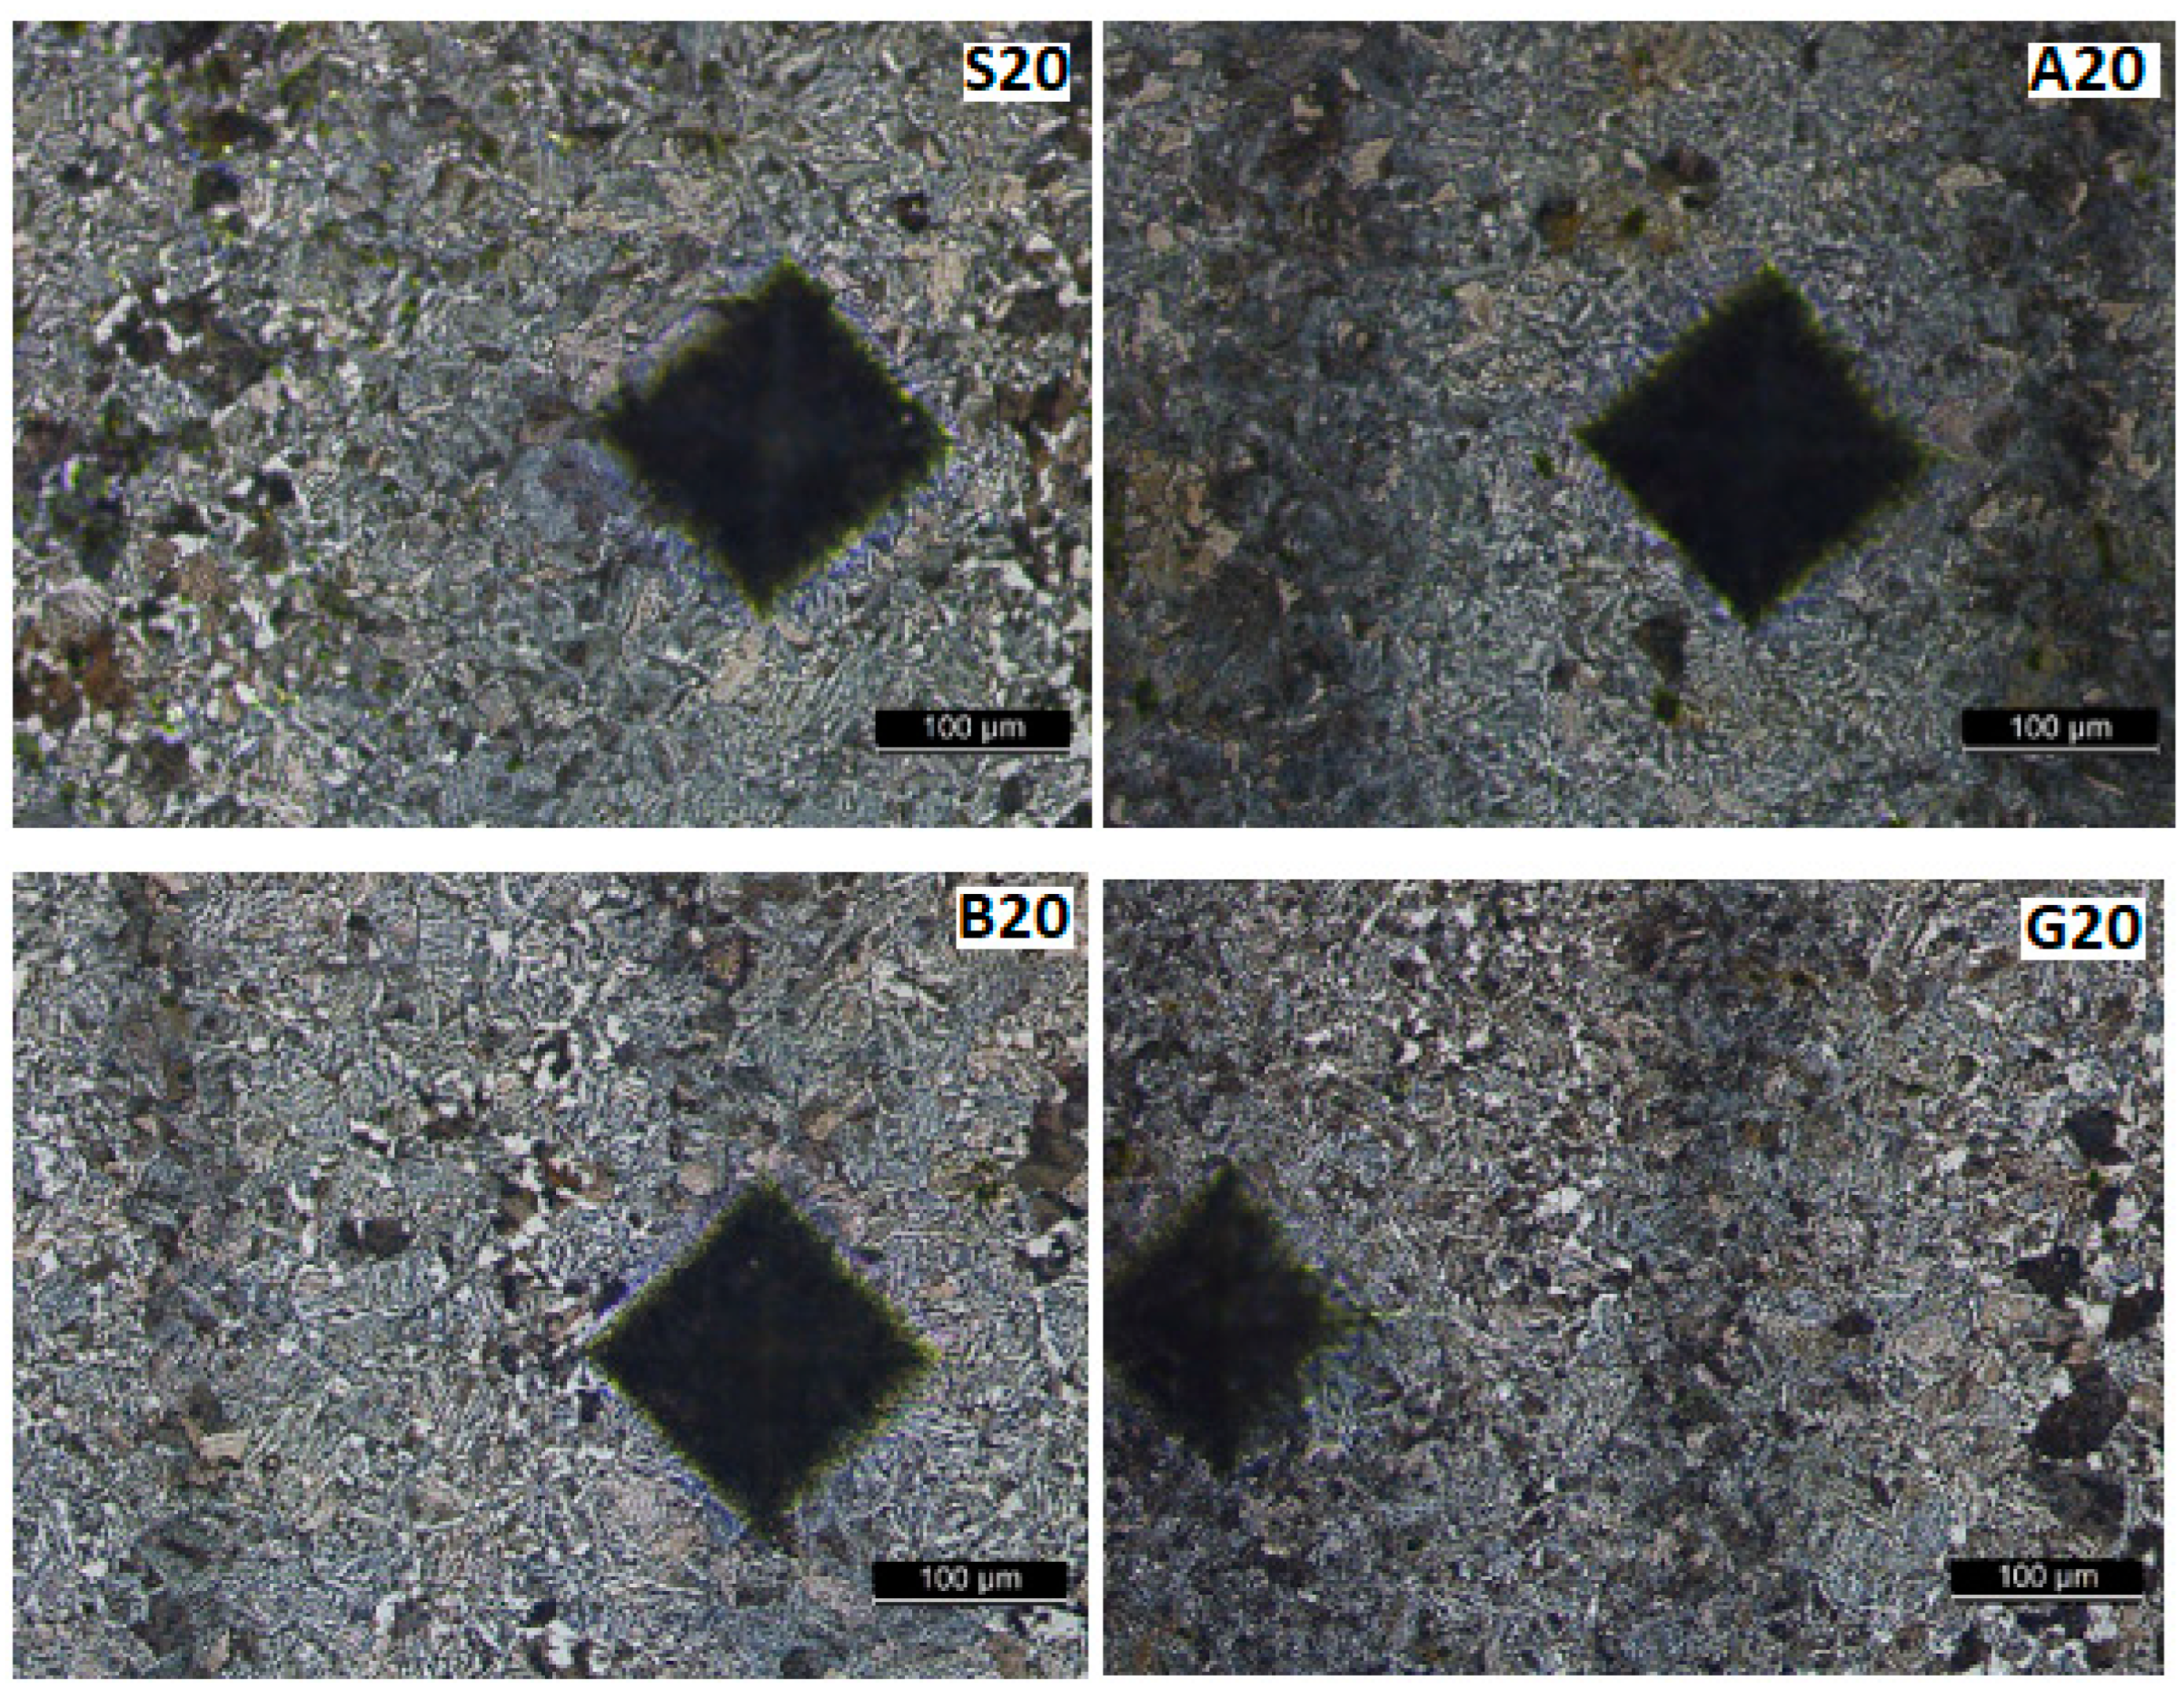
Luca and colleagues used a 250 mm diameter, normalized 42CrMo4 bar as the starting material for a welding investigation. Their base-material images, taken 14 mm from the weld center, retained darker bands that they attributed to the original semi-finished product. These images are useful here because they show banding in a familiar alloy-bar material, with Vickers impressions superimposed on the structure. 3
Select an image to examine it at full size ↗
The diamond-shaped marks are hardness impressions. They are neither voids nor inclusions. Their placement also illustrates why an indentation should be photographed when a local property is being compared with a narrow microstructural feature. The original study's sample labels are retained so that each view can be traced back to its source.
5. Local chemistry changes the response to heat treatment
Hardenability concerns how readily a steel develops a hardened structure as it cools under specified conditions. If local alloy content varies, adjacent regions can follow different transformation paths even within the same treated component. This connects segregation to the principles discussed in Steel Heat Treatment: Microstructure, Hardness and Toughness.
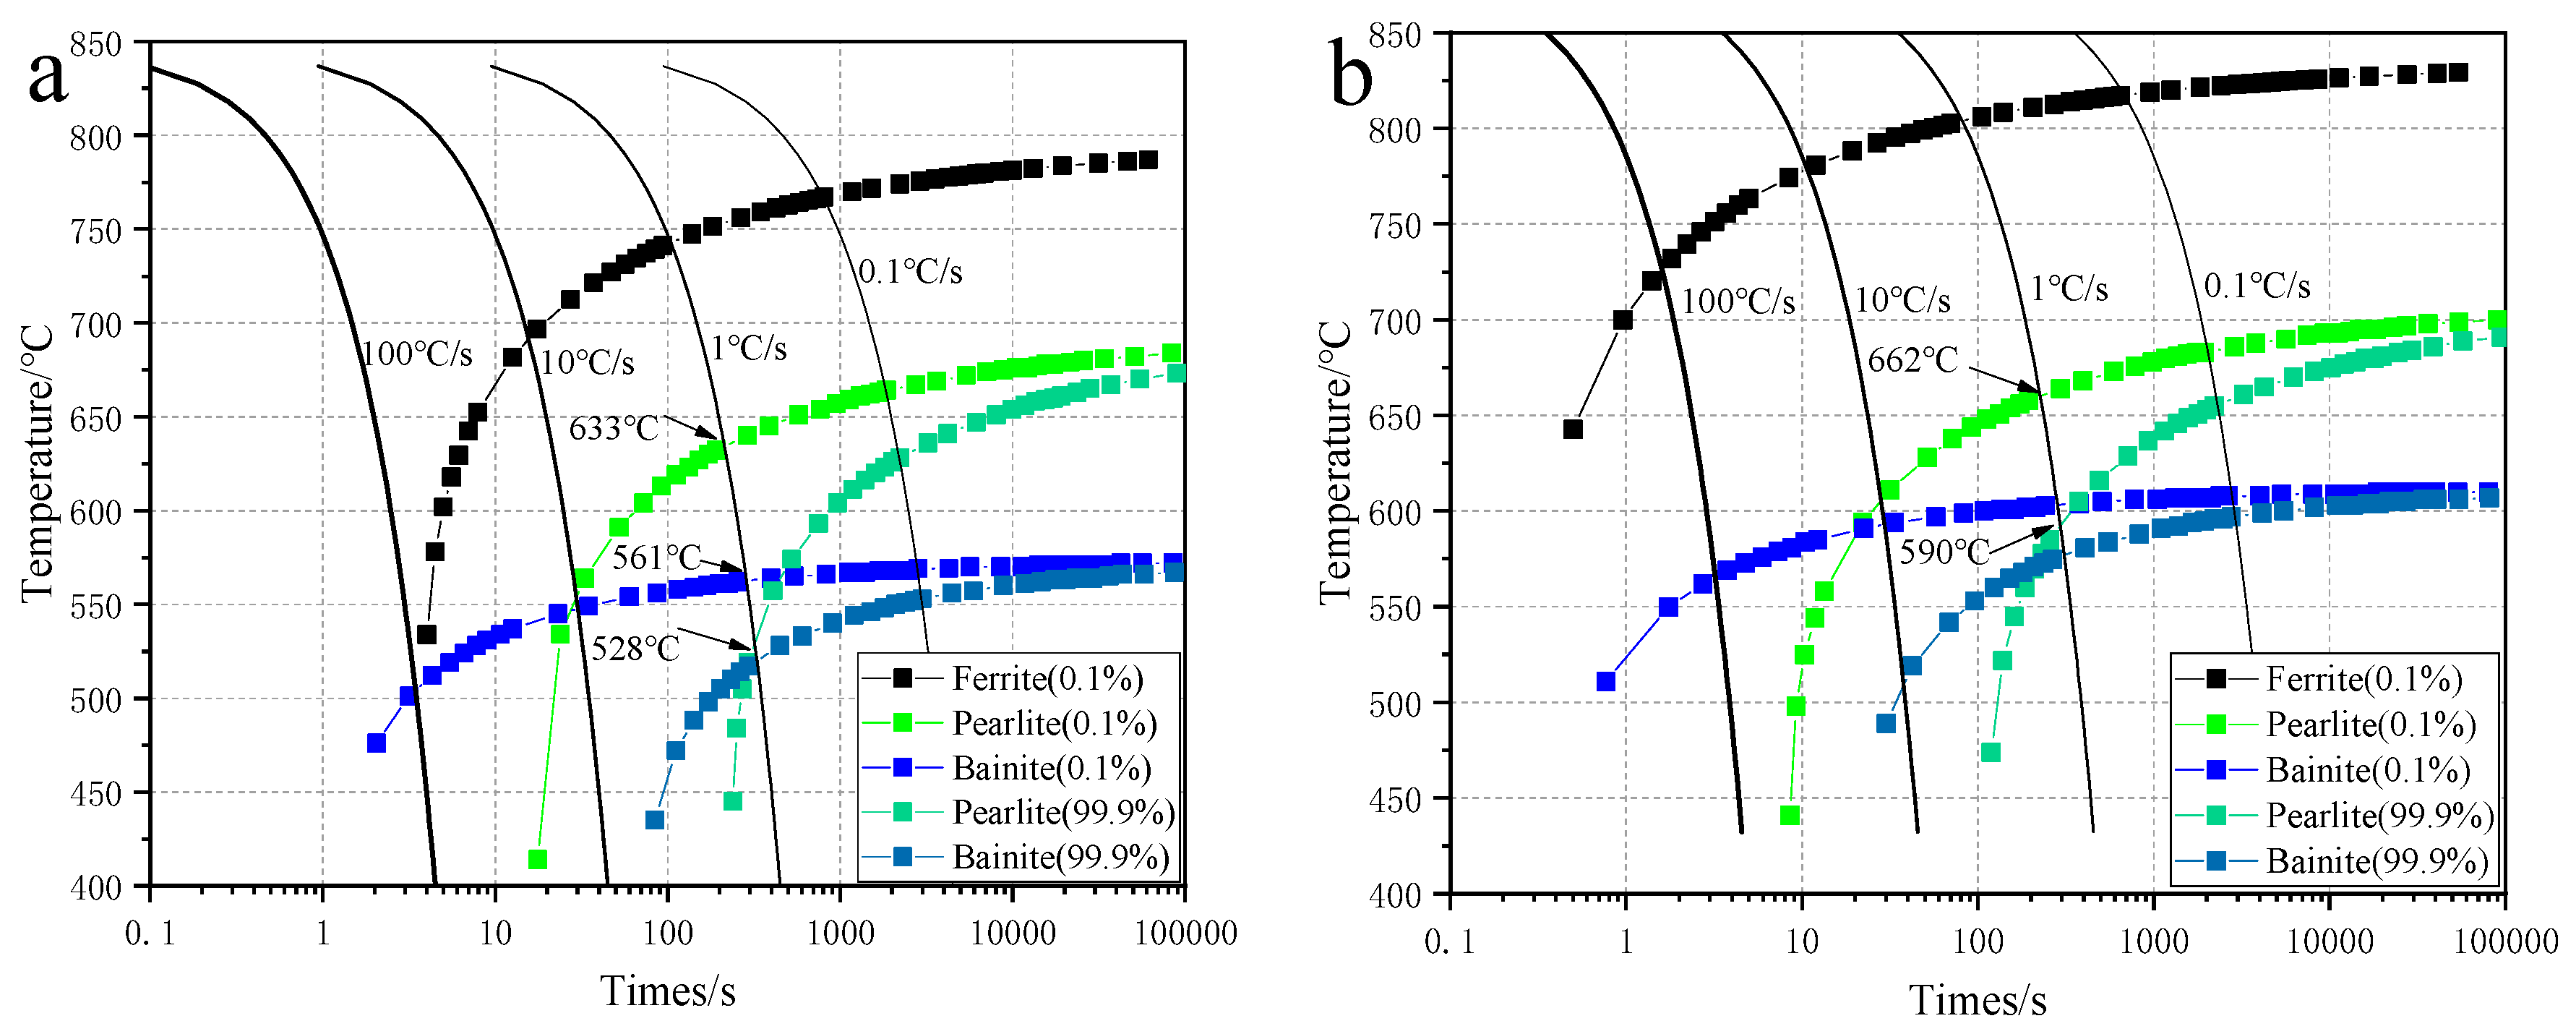
Guo and colleagues explored that connection using continuous-cooling-transformation calculations based on the compositions assigned to the segregated regions. The curves below are calculated CCT diagrams, produced with JMatPro. They help explain the observed structures; they are not measured cooling records from a production bar. 1
Select an image to examine it at full size ↗
The practical question is whether local chemistry, the austenite condition and the actual cooling history favor the same products throughout the section. For a large bar, that question includes both the surface-to-center cooling difference and smaller chemical variations within a given region. Treating these as two separate scales makes a hardness profile easier to interpret.
The drill-bar study provides a direct example. The researchers identified mainly martensite in the darker bands and mainly granular bainite in the surrounding 23CrMoNi structure, with reported values of 424 HV0.2 and 384 HV0.2, respectively. Element mapping linked the bands to chromium, nickel and molybdenum enrichment. 4
Where Jominy testing fits
The Jominy end-quench test characterizes hardness response along a specimen subjected to a defined cooling arrangement. ASTM A255 addresses this hardenability assessment. A Jominy curve is useful for selecting and controlling steel, while a metallographic map answers a spatial question about the material actually sampled. 10
A purchaser investigating bands should therefore connect the heat's hardenability evidence with the finished bar's heat treatment, section size and local examination. The distance marked on a Jominy curve is not a radial coordinate in the delivered rod. Our Jominy and section-size guide explains how to keep those records connected.
6. Two scales of hardness variation
A traverse across a bar or plate can reveal a broad surface-to-center trend. A second, finer examination can investigate the bands within one part of that section. The test spacing and indentation size determine which of those questions is being answered.
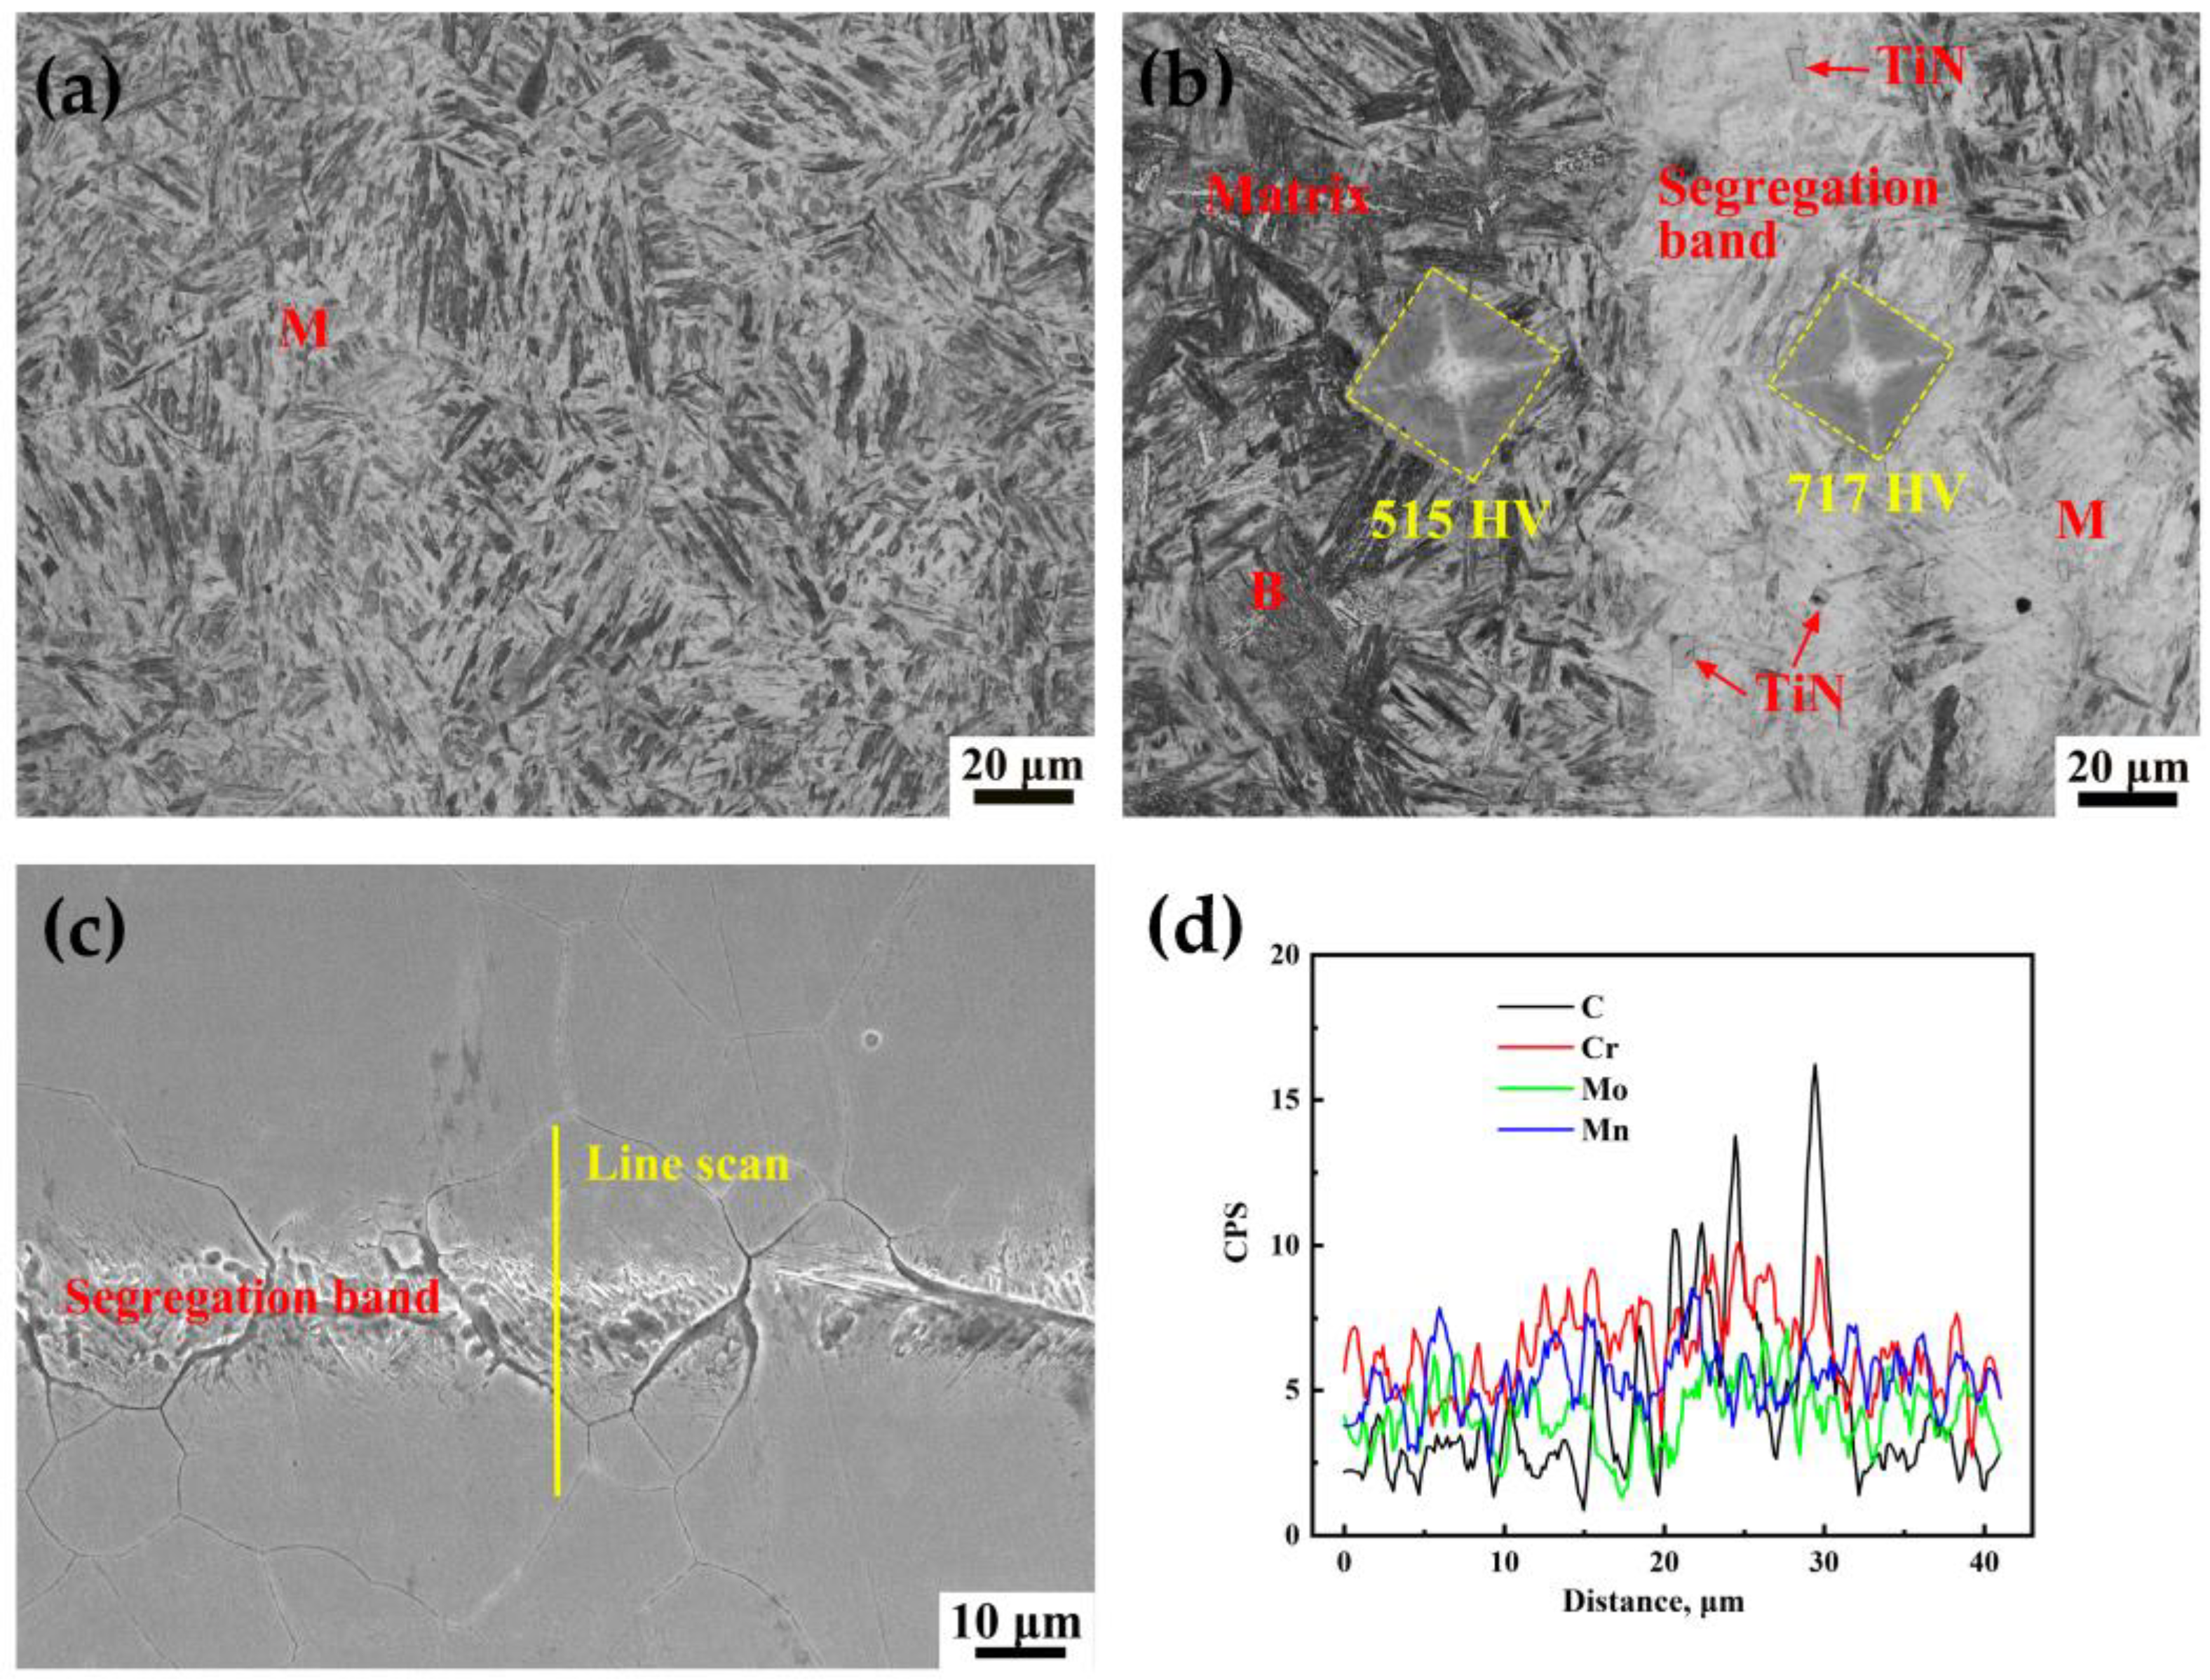
Sun and colleagues examined 65 mm thick NM550 wear-resistant plate, quenched from 900 °C and tempered at 160 °C. In the more severely segregated region, they identified martensite in the bands and a mixture of bainite and martensite around them. They reported local hardness values of 717 HV and 515 HV, a difference of 202 HV. These values belong to the plate and treatment investigated in that paper. 5
Select an image to examine it at full size ↗
The original chemical line scans are retained in the figure. They should be interpreted together with the microscopy; the plotted carbon signal should not be treated as a substitute for a suitably calibrated quantitative carbon determination. The phase labels identify the authors' interpretation of the examined locations.
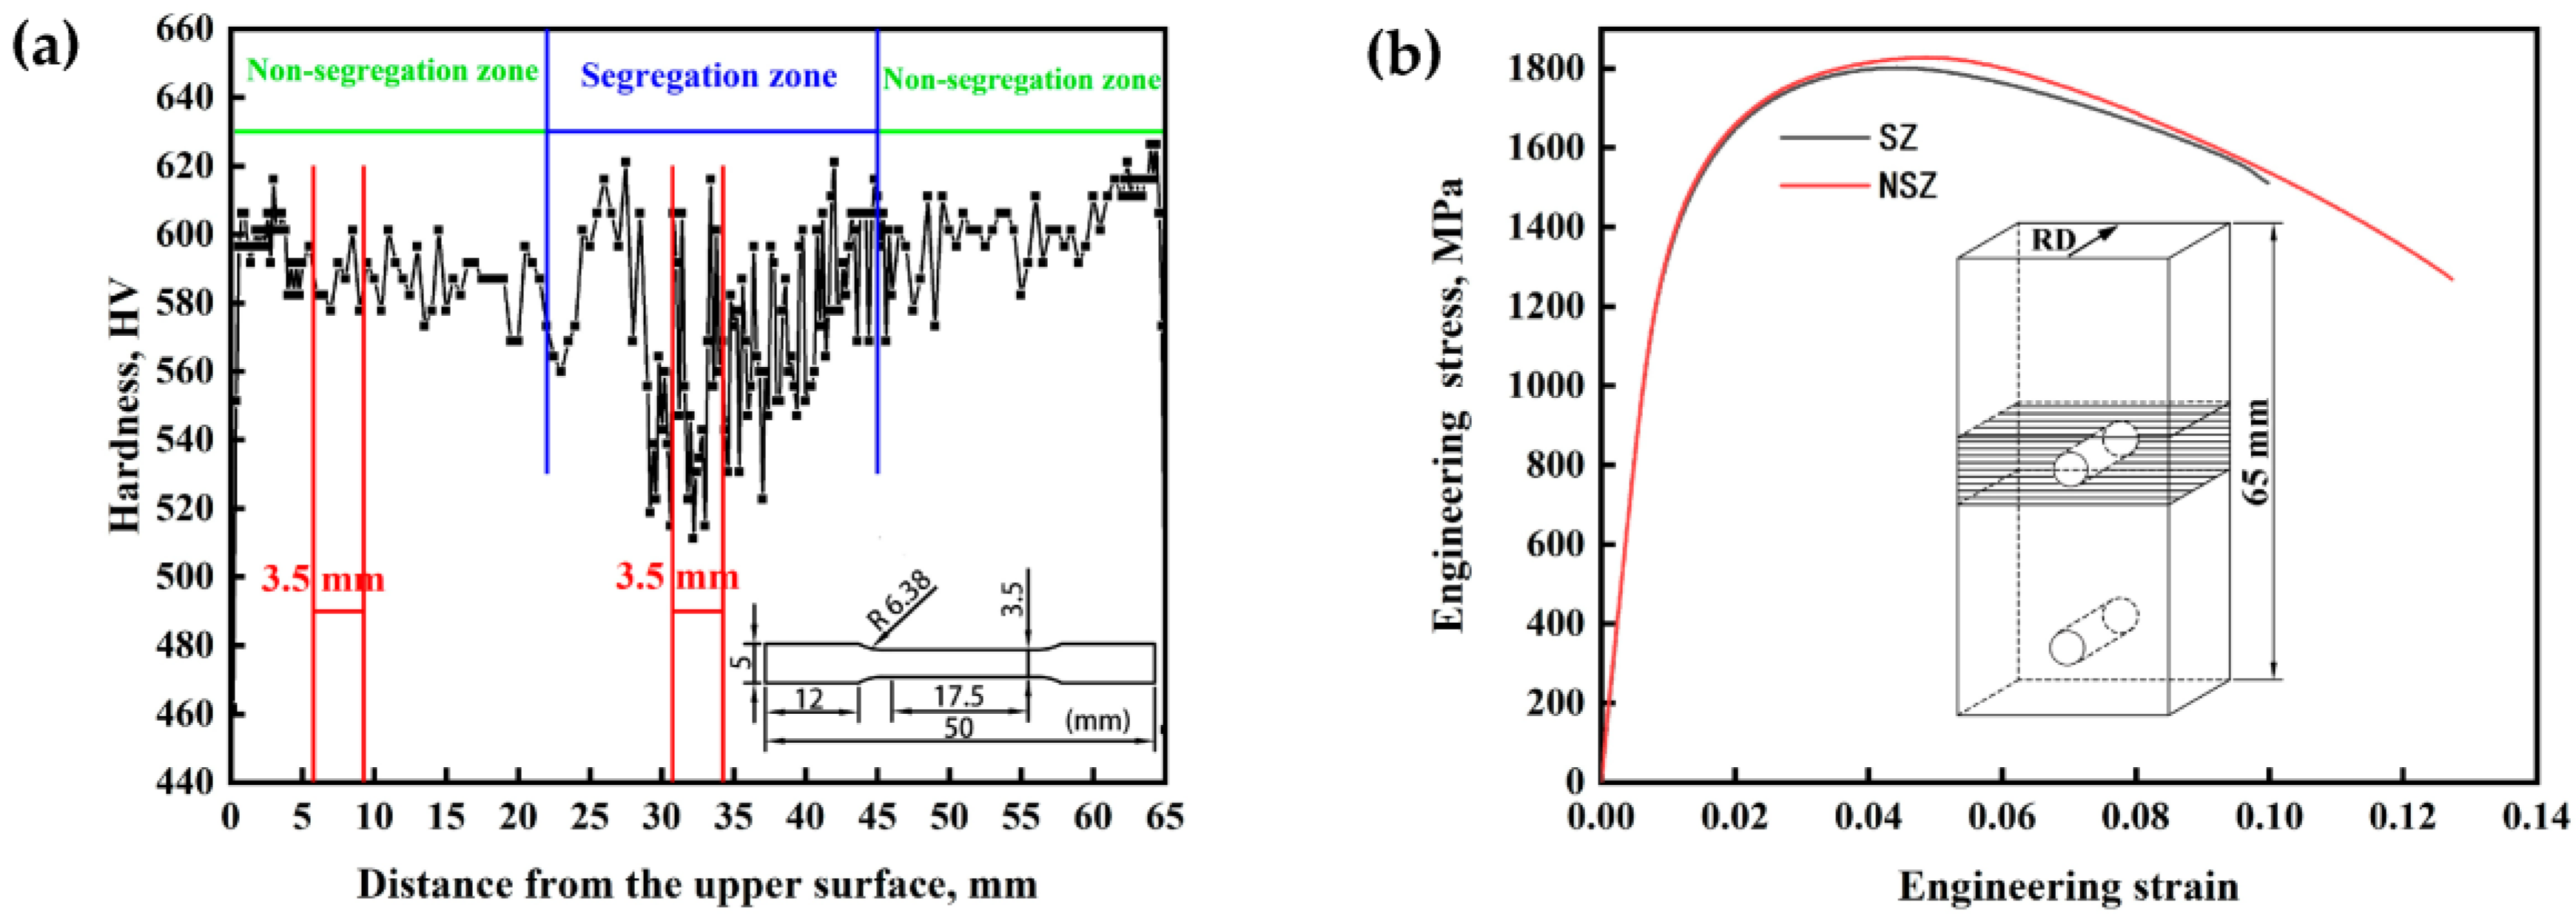
The same study also measured hardness through the plate thickness using a 2 kgf Vickers test force. The broader traverse showed larger fluctuations in the central region. The accompanying tensile curves compare specimens taken from the authors' segregation zone, SZ, and non-segregation zone, NSZ. These are the authors' specimen designations; the paper describes slight segregation even in the region called NSZ. 5
Select an image to examine it at full size ↗
For grinding rods, the corresponding investigation would combine a surface-to-core hardness profile with selected local measurements across any suspicious bands. Record the indent positions on the image. A result averaged over several constituents can be entirely valid, but it answers a different question from an indent placed within one constituent.
ASTM E384 provides the microindentation framework. The report should identify the method, force, dwell time, preparation and measurement locations. Fine features require particular care: an impression that crosses a boundary cannot be read as the hardness of one side alone. 8
7. Hardness, ductility and toughness need separate evidence
Banding matters when the resulting structure changes a property that the component needs. That may involve local resistance to deformation, the direction of crack growth, or variation between test locations. The importance depends on the constituents, their arrangement, loading and the presence of other features such as inclusions.
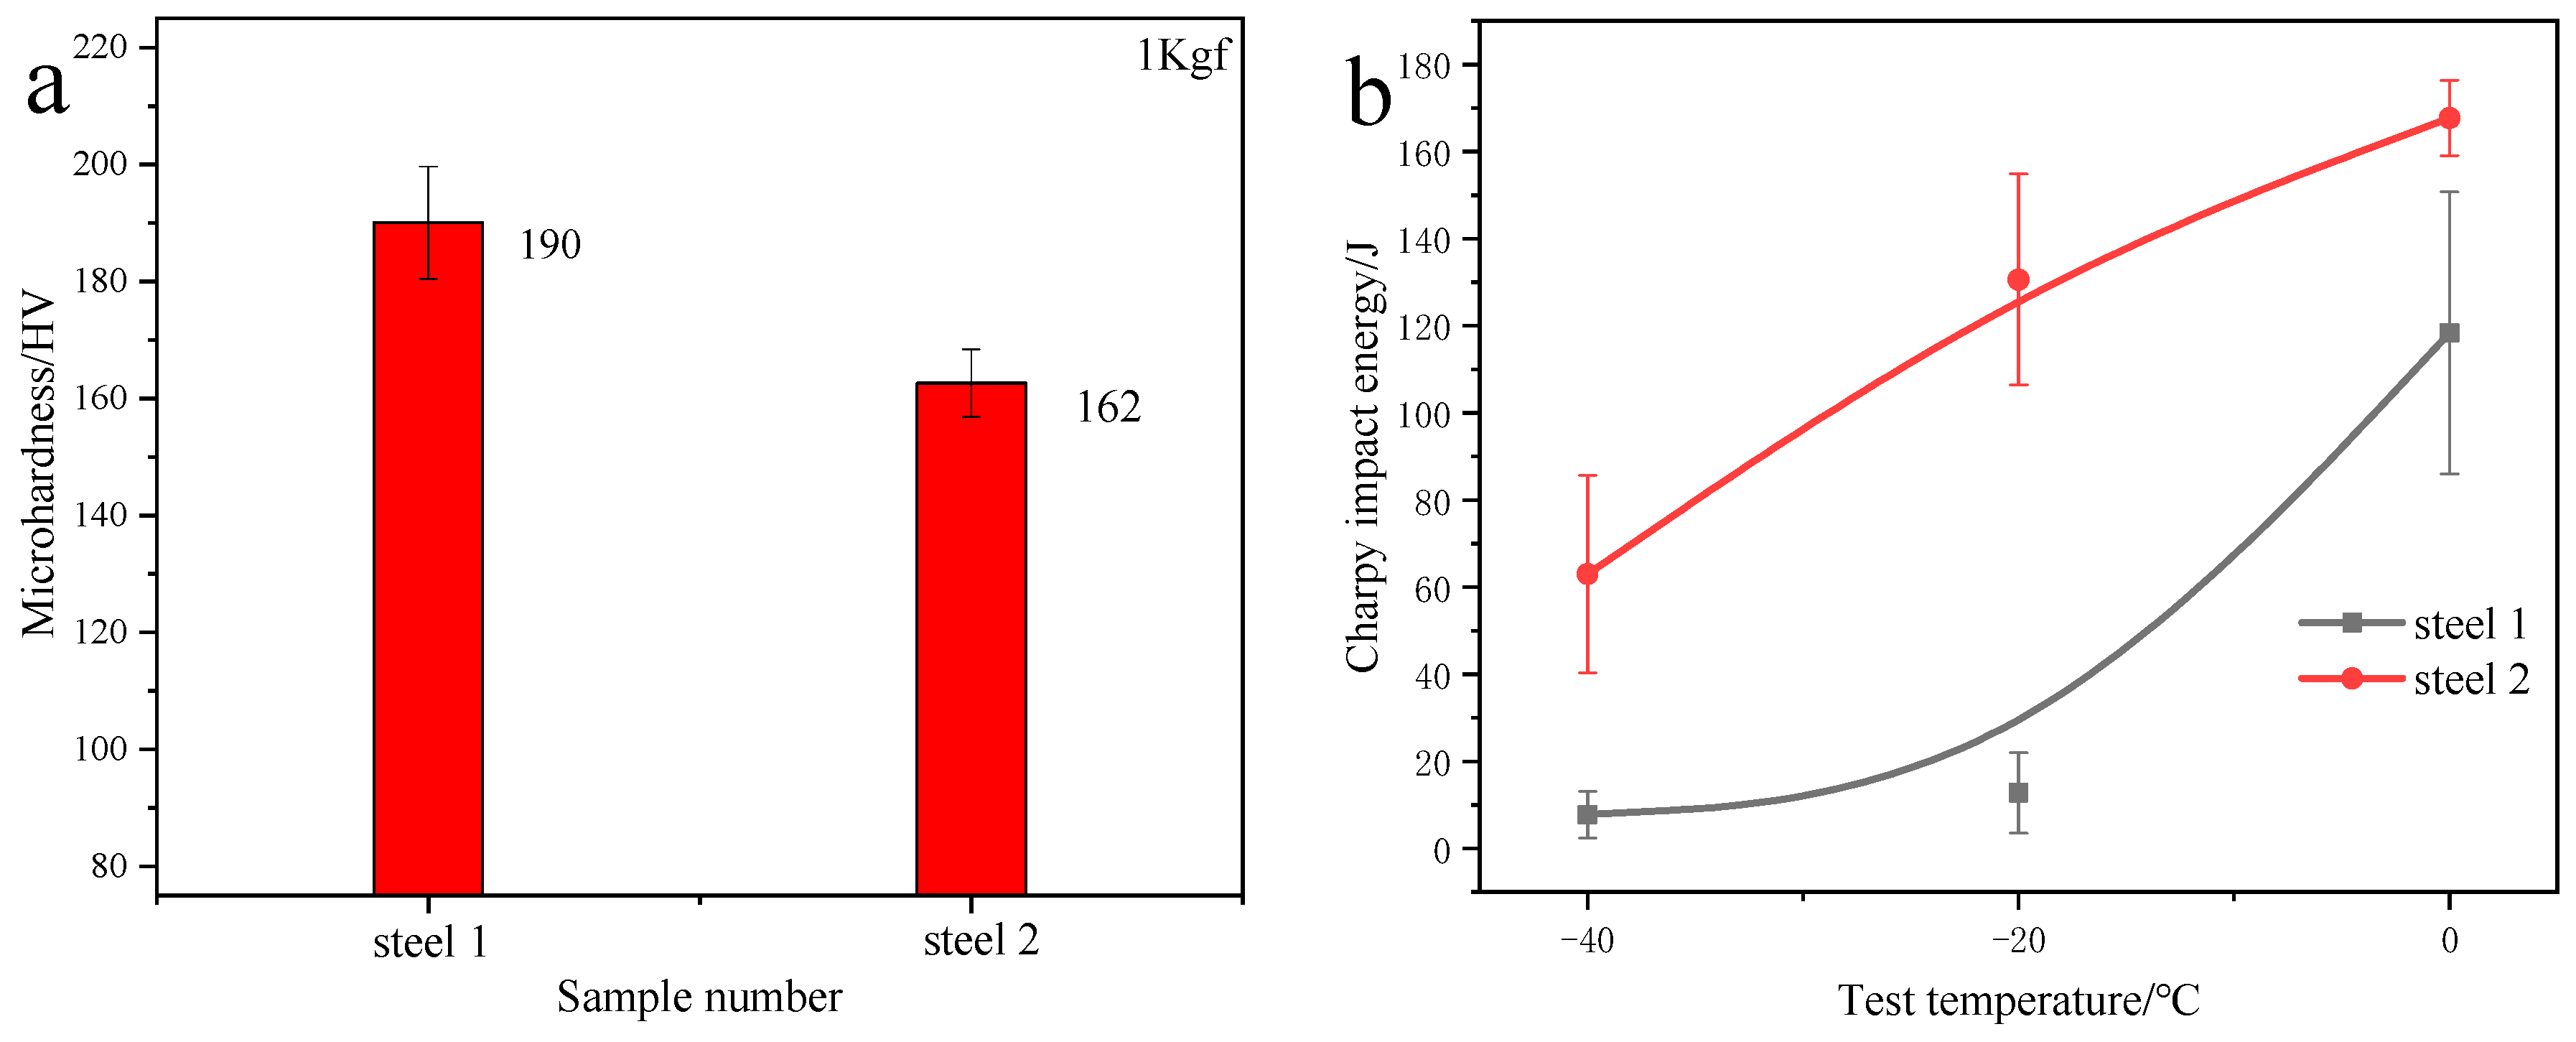
Guo's two U-section steels show why a hardness value should be read beside other measurements. Steel 1 had the higher average hardness in the investigated region, yet Steel 2 had the lower ductile–brittle transition temperature and greater total elongation. Several aspects of the microstructure changed together in this experiment. The results demonstrate an association between the processing route, segregation, structure and properties; they do not isolate banding as the sole variable. 1
Select an image to examine it at full size ↗
| Result reported for the investigated U-section steels | Steel 1 | Steel 2 |
|---|---|---|
| Hardness in the examined segregation region, approximately | 190 HV | 162 HV |
| Ultimate tensile strength | 572.0 ± 4.2 MPa | 552.5 ± 0.7 MPa |
| Total elongation | 25.36 ± 0.79% | 34.40 ± 0.10% |
| Reported ductile–brittle transition temperature | −10 °C | −40 °C |
Source: Guo et al., Table 2 and Figure 6. The hardness measurements used a 1 kgf force and intentionally sampled both ferrite and pearlite; ten measurements were averaged. These are experimental section-steel results, with the authors' reported scatter. They are not acceptance values for grinding rods or shafts. 1
This leads to a better specification question: which property, at which location and in which direction, needs to be controlled? A shaft carrying cyclic bending loads calls for evidence relevant to its surface, section and fatigue-critical geometry. A grinding rod needs to be evaluated against its actual combination of abrasion, impact and bending. A banding result becomes useful when it is connected to that service requirement.
8. Sampling direction changes the picture
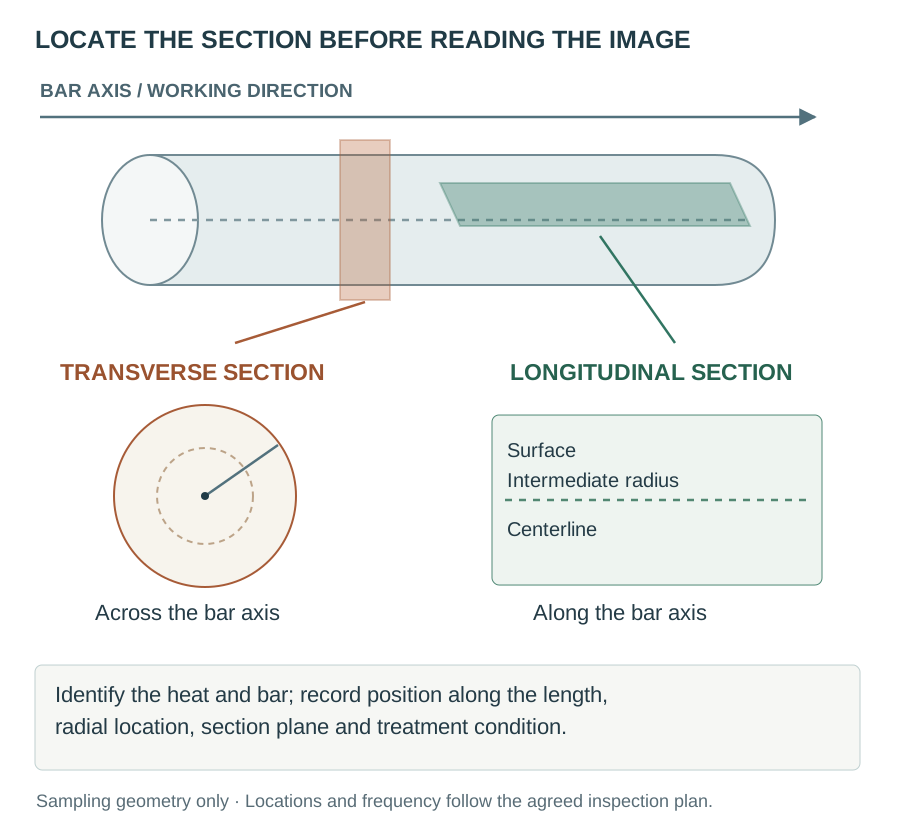
A longitudinal section follows the working direction. A transverse section cuts across it. An elongated region can appear as a long band in one view and as a compact or irregular patch in the other. An examination that omits orientation loses part of the information needed to interpret the structure.
Select an image to examine it at full size ↗
Record both the position along the bar and the location within its radius. “Center sample” is incomplete unless the report also identifies the bar, the longitudinal position and the section plane. Where a defect is localized, retain an overview that links the detailed images to the larger piece.
For routine comparisons, use corresponding positions, the same delivered or heat-treated condition, comparable preparation and a consistent selection of fields. For an investigation, add targeted fields around the indication while retaining representative fields elsewhere. A targeted image can establish what a feature looks like; representative coverage helps establish how widely it occurs.
ASTM E1268's stereological assessment uses longitudinal planes parallel to the deformation direction. The method does not reconstruct the complete three-dimensional structure. A transverse overview remains valuable for locating the region and planning further work. 6
9. Select the examination to match the question
Start with an overview, then increase resolution as the question becomes more specific. An expensive analysis of a poorly located specimen can leave the original problem unanswered.
| Question | Examination | What should accompany the result? |
|---|---|---|
| Is there a large segregated region or another internal indication? | Macroetch examination; ASTM E381 where specified | Product condition, section location, preparation, overview and identification of indications |
| How strongly is the microstructure aligned or banded? | Metallography and the applicable ASTM E1268 procedure | Orientation, field selection, magnification, feature definition and reported measures |
| Which elements vary across the feature? | Appropriately selected local chemical analysis, maps or line scans | Instrument conditions, preparation, scale, calibration and matched locations |
| Are the bands locally harder? | A suitable indentation series, with ASTM E384 where applicable | Test force, dwell, indent images, locations and individual results |
| Does the feature affect the required performance? | Mechanical tests suited to the product and service question | Specimen position, orientation, temperature, test method and comparison condition |
ASTM E381 covers macroetch testing of carbon and low-alloy steel bars, billets, blooms and forgings. Its public summary emphasizes agreement on the manufacturing stage, section locations and examination conditions. Those details should be settled before interpreting a dark region as an unacceptable indication. 7
For banding assessment, a single score also needs a definition. Measures of orientation, band spacing and the distribution of features describe different aspects of an image. A chemistry-based segregation ratio describes another aspect again. Two reports are comparable only when the method, measured feature and sampling basis are compatible.
ASTM E1268 provides assessment methods; it does not set universal acceptance limits. The applicable product specification or an agreement between purchaser and manufacturer must establish the acceptance requirement. 6
10. What heat treatment can change
There are two related objectives: changing the transformation products and reducing the underlying chemical variation. They need to be assessed separately.
Changing the cooling path can change the contrast between adjacent regions by changing the phases that form. The drill-bar work showed that modifying hot rolling and introducing faster cooling improved the measured distribution of banded features, while alloy segregation remained detectable. 4
Homogenization addresses composition differences through diffusion. The relevant distance matters, as do temperature, time and the elements involved. A treatment that changes grain size or suppresses ferrite–pearlite banding need not have homogenized a large segregated region. The grain-size experiments and the billet-to-section study illustrate why the final appearance must be read together with the preceding process. 1, 9
| Processing action | What to examine afterward |
|---|---|
| Adjust solidification control | Distribution and severity of segregation in the casting, followed through to the product |
| Change hot-working or cooling practice | Band geometry, constituent distribution, grain structure and relevant mechanical properties |
| Apply a homogenization treatment | Measured reduction in the relevant chemical variation, together with the resulting grain structure |
| Quench and temper | Transformation products, local and section-scale hardness, and the specified toughness or ductility |
| Peel or grind the surface | Removed depth and final surface condition; internal segregation remains a separate inspection question |
The practical objective is a repeatable processing route that delivers the required properties. Heating hotter, holding longer or cooling faster should follow a metallurgical evaluation of the grade and section, with examination of the treated material. A cleaner-looking micrograph is one observation in that evaluation.
11. When bands and inclusions meet a crack
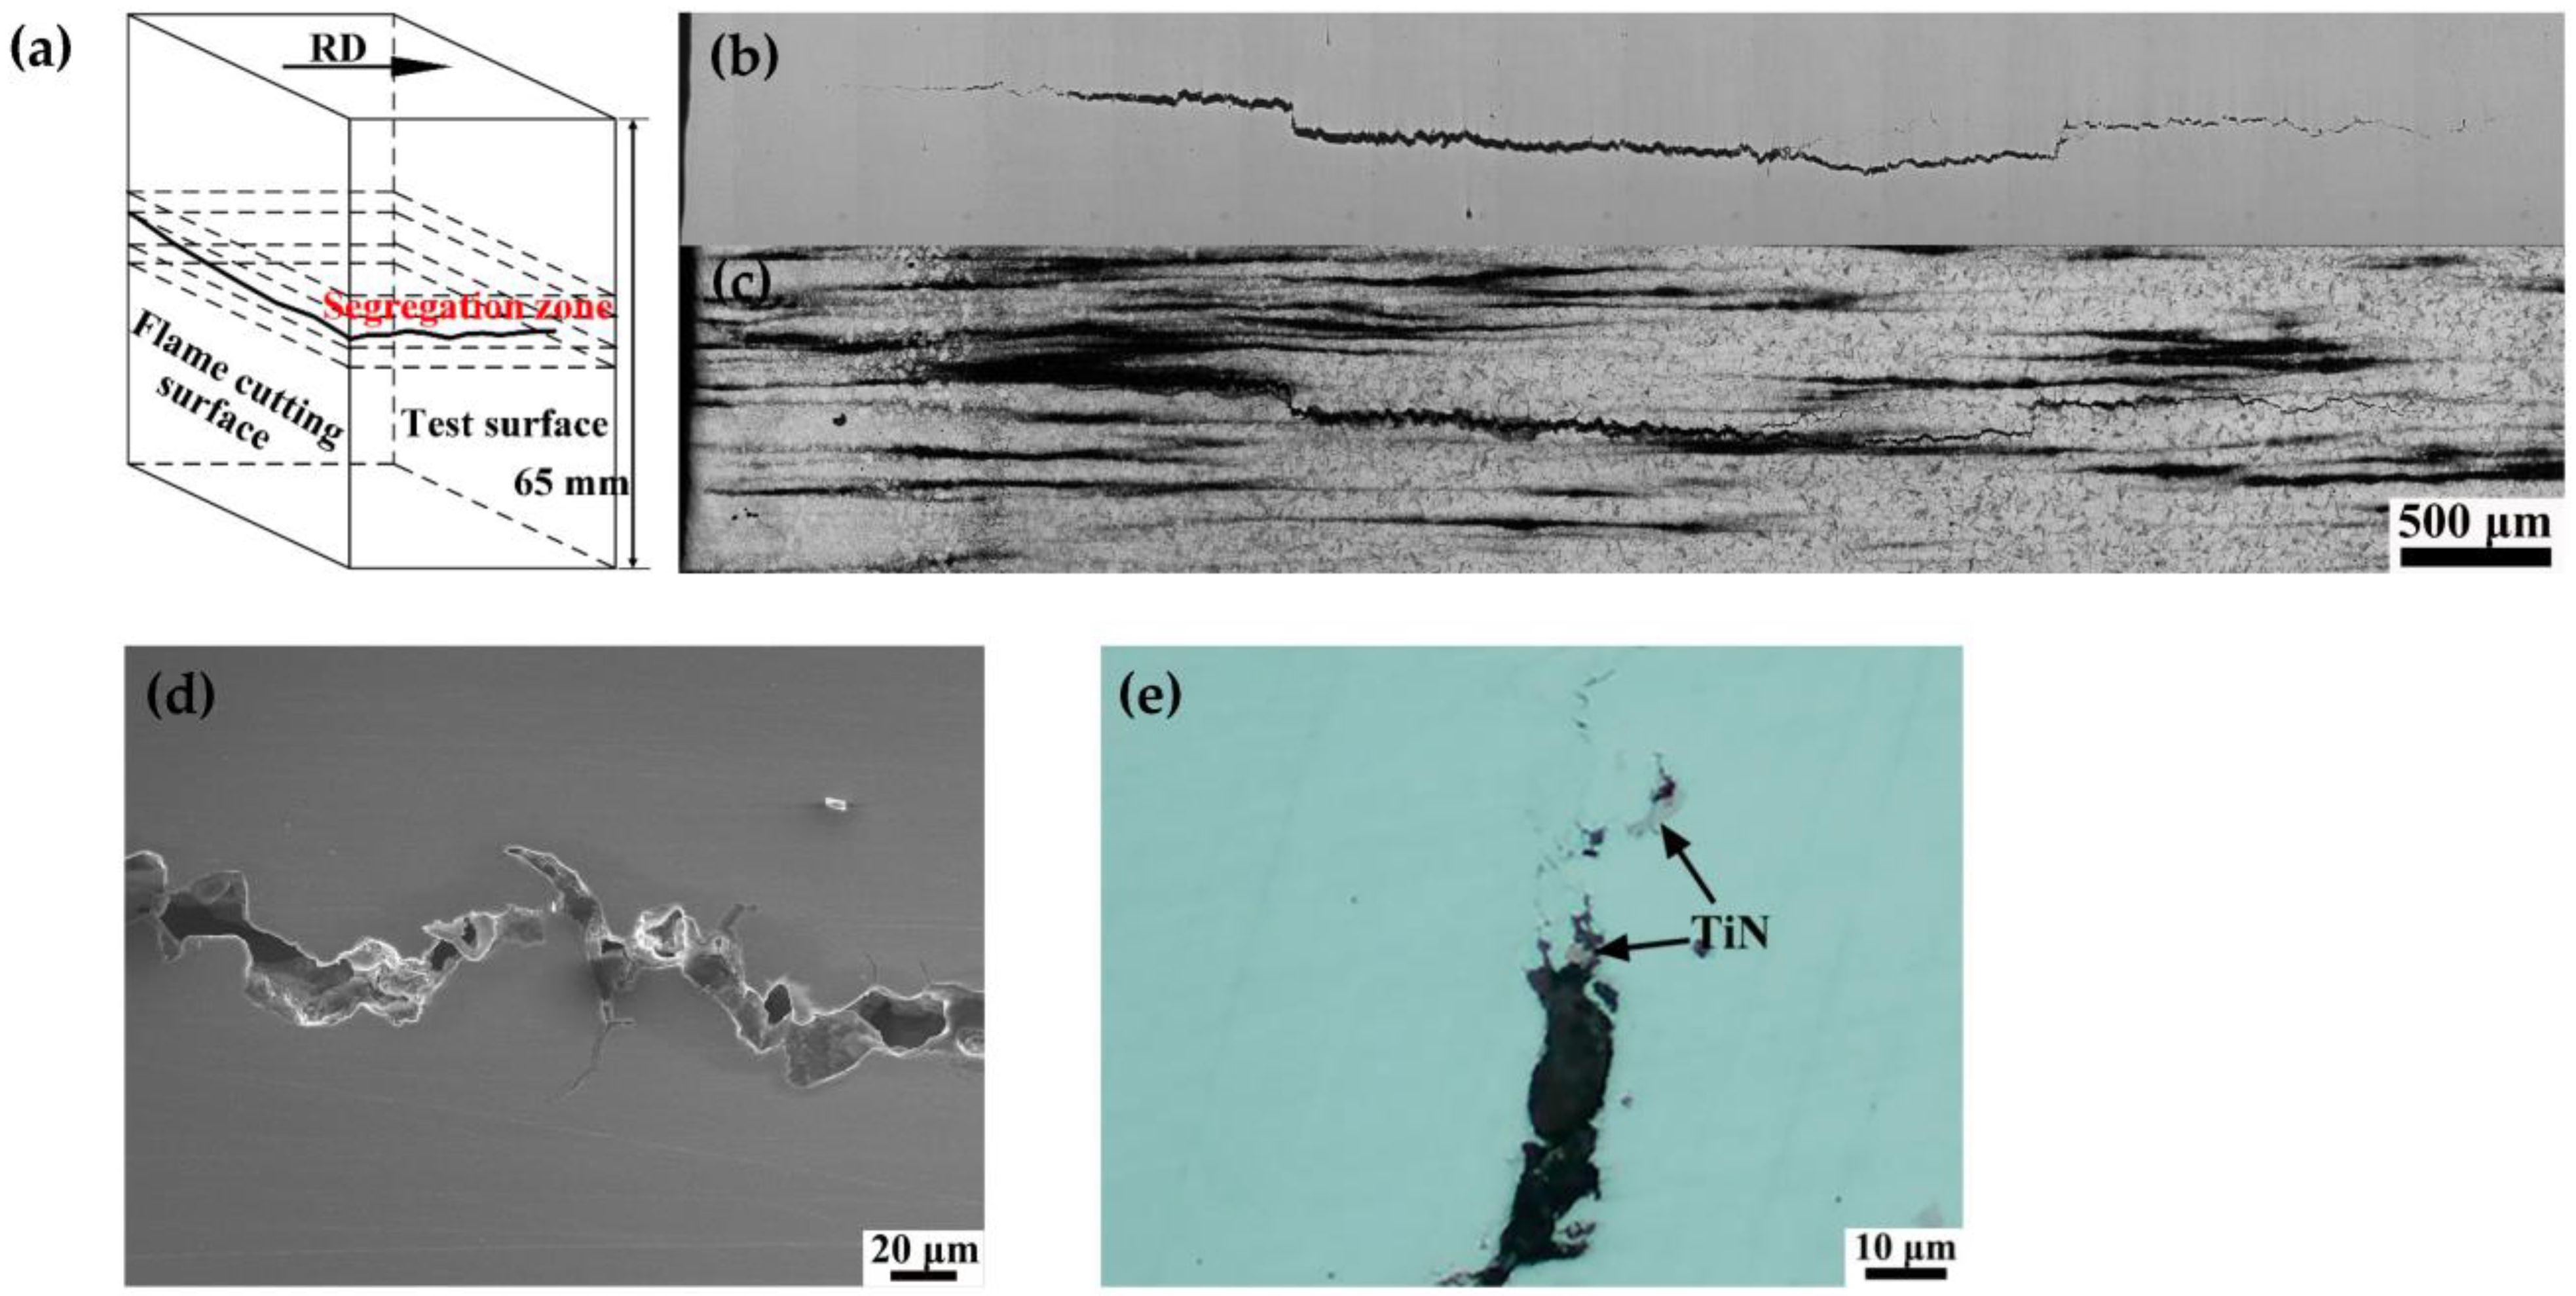
The NM550 investigation began with delayed cracking after flame cutting. Its authors examined the crack path, the surrounding structure, local hardness and TiN inclusions together. This makes it a useful continuation of the inclusions article: an inclusion and the matrix around it belong to the same fracture problem. 5
Select an image to examine it at full size ↗
Read the sequence from the specimen location to the more detailed views. The crack follows a particular region of the plate, and the smaller images examine how it interacts with the surrounding structure and particles. The paper discusses the combined roles of segregation, hard regions, inclusions and hydrogen-assisted cracking in that flame-cut plate.
For a grinding rod or shaft, the investigative lesson is to preserve the relationship between the fracture and the nearby material. Document the intact piece and fracture location before sectioning. Relate the metallographic specimen to the fracture origin, and compare it with material sufficiently removed from the damaged region. A crack near a band is an observation to explain through this wider evidence.
12. Applying the evidence to grinding rods and shafts
Grinding rods
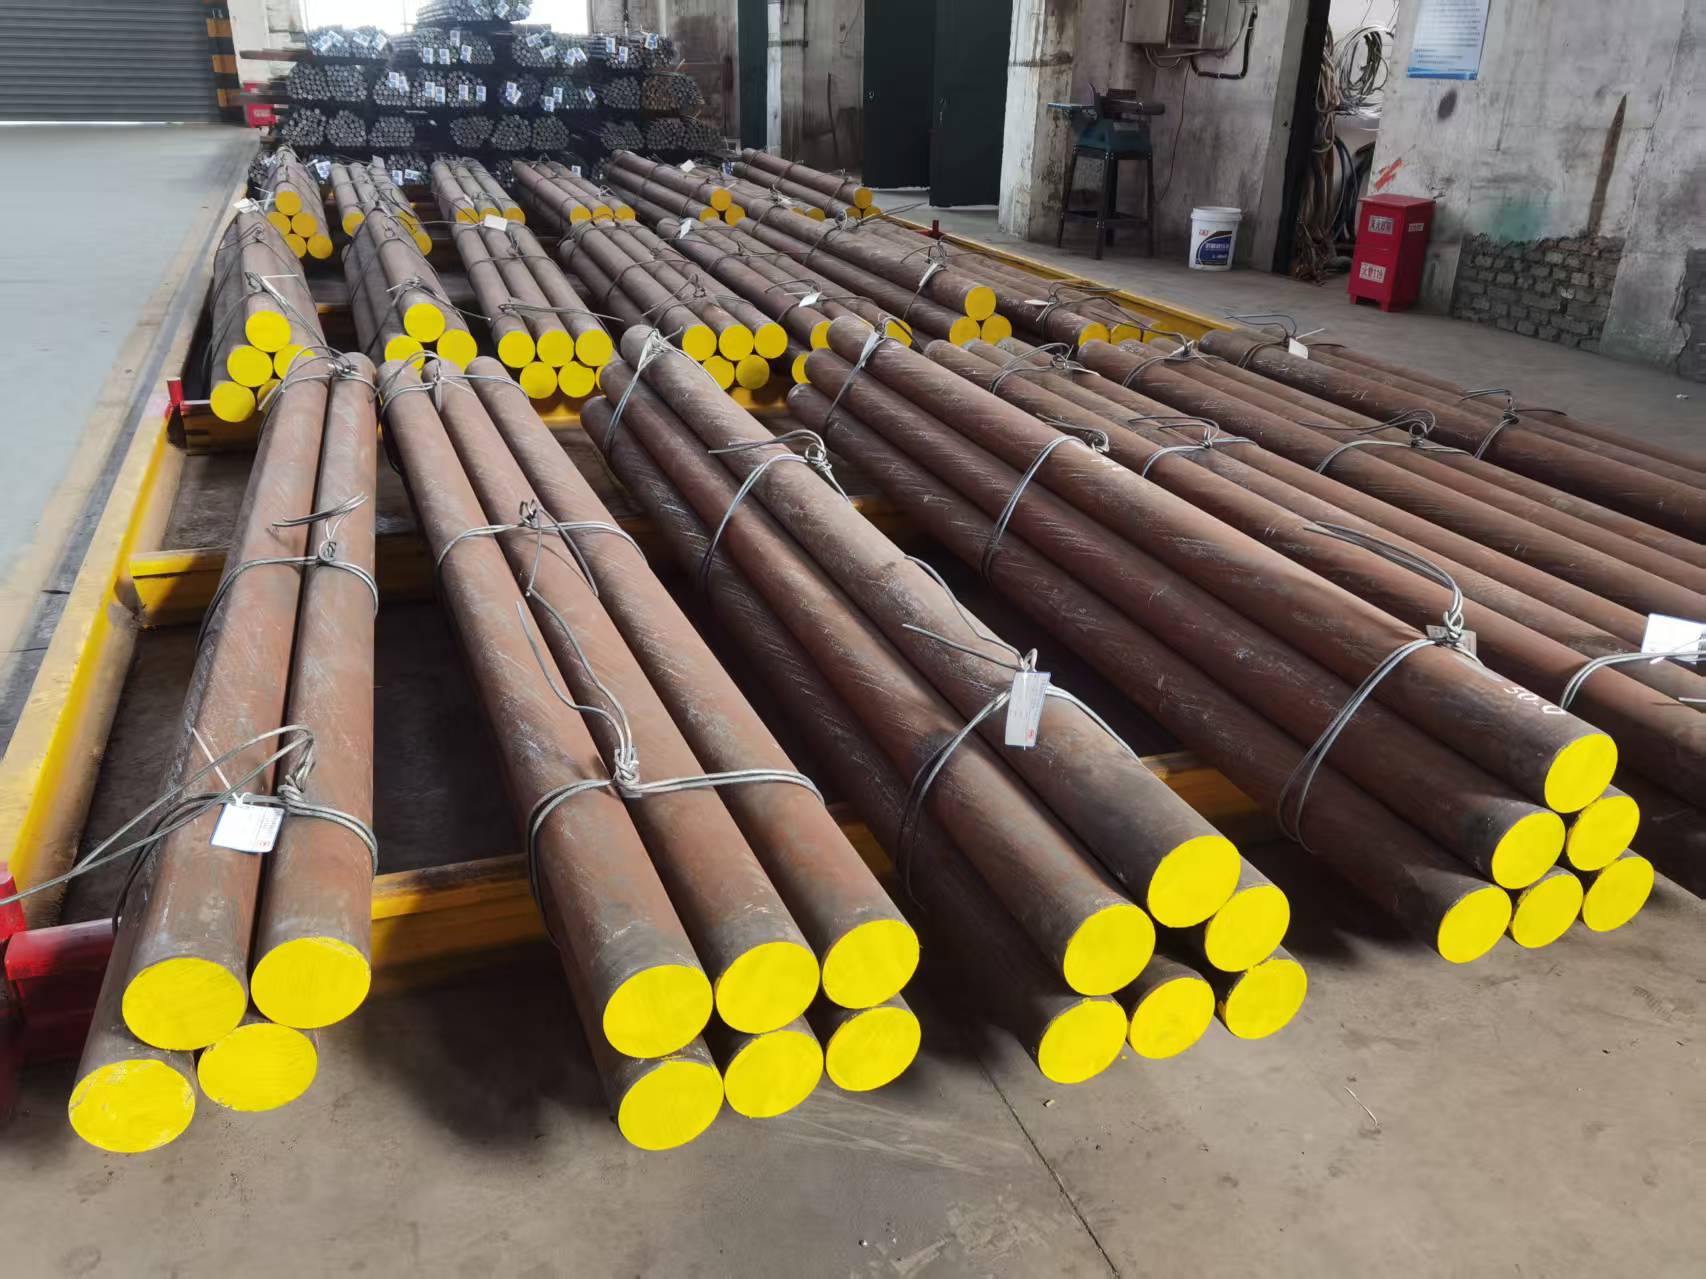
A sensible investigation starts with the recovered rod, its heat and treatment records, an unused retained rod where available, and the mill operating history. The examination should connect the worn or fractured region with diameter, hardness profile, microstructure and any internal indications. The aim is to establish whether a material variation is present and whether it is relevant to the observed damage.
Select an image to examine it at full size ↗
For an unusual wear pattern, look for a consistent spatial relationship between the material features and the worn surface. For breakage, locate the fracture origin before choosing where to section. If bands are present, compare their local structure and hardness with the adjacent matrix and with a representative retained sample. Operating conditions still belong in the investigation: the grinding-rod breakage and bending guide sets out the records that help connect the material examination to the mill incident.
A mill trial or service comparison should keep the operating basis explicit. A banding measurement by itself provides no numerical conversion to wear rate, rod life or consumption per tonne. Those outcomes need service evidence with a defined comparison.
Shafts and machined bars
For a shaft, connect the material's working direction with the component axis, critical geometry and the direction of testing. Include the delivered bar condition and subsequent machining or heat treatment. Where a fracture is being investigated, surface condition, stress concentration, inclusions and the location of the origin should be examined alongside banding.
Internal banding also differs from machining distortion in 4140 and 42CrMo4. A banded image does not measure residual stress. Distortion and microstructural variation may both need investigation, but their evidence comes from different observations and tests.
13. Read the report in a useful order
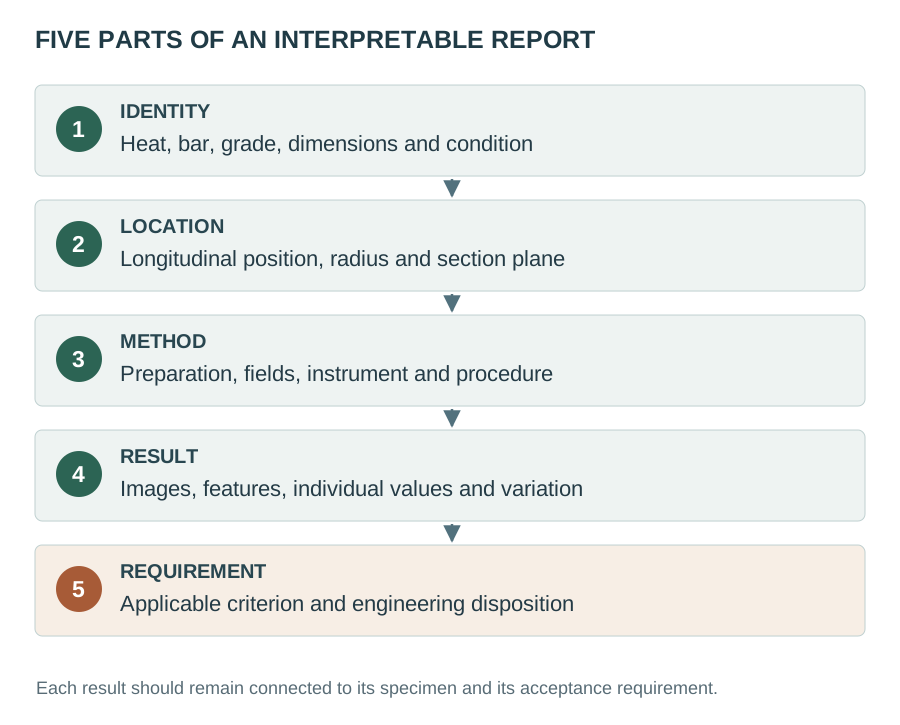
Begin with specimen identity. Then establish location and condition, examine the method, and finally interpret the result against the requirement. This order avoids spending time debating a number that belongs to the wrong position or treatment condition.
Select an image to examine it at full size ↗
A complete record should make the following points easy to recover:
- Material and condition: heat number, bar or lot identity, grade, dimensions, delivery condition and any later treatment.
- Sampling map: position along the bar, radial position, plane of section and working direction.
- Examination basis: preparation, etchant, magnification, field selection, examined area and applicable procedure.
- Observations and measurements: overview images, constituent identification, band dimensions or assessment results, and any local chemistry or hardness measurements.
- Decision basis: the specified acceptance requirement, the property being protected, and the proposed follow-up where the evidence is incomplete.
For a purchase specification, useful wording can be concise:
Report banding in the agreed product condition and sampling locations using the specified examination method. Include the section orientation, representative micrographs with scale bars, constituent identification and reported assessment measures. State the agreed acceptance criterion. Where localized segregation is suspected, define the additional chemistry, hardness or mechanical examination before disposition.
The inspection plan should supply the actual locations, frequency, method edition and acceptance values. This wording is a starting point for that agreement, rather than a finished material specification.
Open the banding-report review checklist →
14. Questions that come up in practice
Is every banded steel unacceptable?
No. The engineering significance depends on the constituents, their geometry and distribution, the loading and the specified requirements. Establish how the feature relates to the property needed in service. ASTM E1268 describes assessment procedures and leaves acceptance limits to the applicable specification or agreement. 6
Can a passing chemical analysis coexist with segregation?
Yes. An analysis characterizes the material sampled by that measurement. Local composition differences can exist within a product whose reported chemistry meets the specified range. The billet and rolled-section maps from Guo and colleagues show why the location and spatial scale of an analysis matter. 1
Does normalizing remove banding?
Normalizing changes the grain structure and transformation history, which can change the visible pattern. Chemical variation can remain after normalizing. The normalized 42CrMo4 starting bar discussed here still exhibited banding in its base material. Assess the resulting condition directly. 3, 9
Does a smooth hardness traverse prove that the bar is uniform?
It establishes the results at the sampled positions and test scale. Narrow bands may require a finer investigation tied to the microstructure. Before interpreting the traverse, examine the spacing and the size and placement of the impressions. The NM550 example shows why section-scale and local measurements are complementary. 5, 8
Are bands the same as elongated inclusions?
No. Microstructural bands concern the arrangement of the steel's constituents; inclusion stringers concern the arrangement of non-metallic particles. They can occur together. Polished-surface examination, etching and appropriate compositional analysis help identify which features are present and how they relate to one another. 1, 5
Can ultrasonic testing replace metallography for banding?
Ultrasonic testing and metallography answer different inspection questions. A UT result should be interpreted within its agreed procedure and acceptance criteria. It does not itself identify the phases, local chemical distribution or microscopic banding measures described here. Specify the examination needed for the actual question; the steel-bar UT guide explains that inspection separately.
15. From a visible pattern to an engineering decision
The most useful banding assessment connects three things: the material's processing history, the structure at an identified location, and the property required of the finished part. Chemistry explains why neighboring regions may transform differently. Microscopy reveals their arrangement. Local hardness and appropriately chosen mechanical tests establish what that arrangement means for the question being investigated.
For grinding rods and shafts, bring those observations back to the delivered lot, the treatment condition and the service evidence. A well-located micrograph with a clear question is worth considerably more than a severity label whose sampling basis has been lost.
For a discussion of a particular bar or grinding-rod requirement, send JOTAIN the grade, dimensions, delivery condition and available inspection report. Include the location and orientation of any metallographic specimens so that the reported observations can be interpreted in their proper context.
References and figure sources
The research images retain the original authors' specimen labels, panel letters, annotations and scale bars. Each caption identifies its material and source. The three explanatory drawings are original JOTAIN schematics, and the grinding-rod photograph comes from JOTAIN's existing product photography. Research specimens and results are attributed to the cited studies.
The standard editions listed below are the editions consulted for this article. Test execution and contractual acceptance should follow the edition agreed for the order.
- Guo, F.; Wang, X.; Wang, J.; Misra, R. D. K.; Shang, C. (2020). The Significance of Central Segregation of Continuously Cast Billet on Banded Microstructure and Mechanical Properties of Section Steel. Metals 10(1), 76.
- Jägle, E. A. (2007). Modelling of Microstructural Banding during Transformations in Steel. University of Cambridge, MPhil dissertation.
- Luca, M. A.; Roata, I. C.; Croitoru, C.; Todi-Eftimie, A. L. (2024). Vibration-Assisted Welding of 42CrMo4 Steel: Optimizing Parameters for Improved Properties and Weldability. Materials 17(11), 2708.
- Meng, Y.; Yan, C.; Wen, J.; Ju, X. (2024). Assessing the Banding Degree of Martensite in the Bainite Matrix through EPMA. ISIJ International 64(6), 1029–1036.
- Sun, H.; Du, H.; Tong, K.; Liu, L.; Yan, Q.; Zuo, X. (2023). Influence of TiN Inclusions and Segregation Bands on the Mechanical Properties and Delayed Crack in Thick NM550 Wear-Resistant Steel. Materials 16(17), 5856.
- ASTM International. ASTM E1268-19: Standard Practice for Assessing the Degree of Banding or Orientation of Microstructures. Public scope and significance-and-use summary.
- ASTM International. ASTM E381-22: Standard Method of Macroetch Testing Steel Bars, Billets, Blooms, and Forgings. Public scope and significance-and-use summary.
- ASTM International. ASTM E384-22: Standard Test Method for Microindentation Hardness of Materials. Public scope and significance-and-use summary.
- Kusaka, K.; Araki, S.; Iwamaru, M. (1970). On the Influence of Austenite Grain Size and Forging Ratio on Ferrite Banded Structure. Journal of the Japan Institute of Metals 34(9), 957–962.
- ASTM International. ASTM A255-20a: Standard Test Methods for Determining Hardenability of Steel. Public scope summary.