
Steel heat treatment changes properties by changing the material’s internal structure. Heating, holding and cooling alter how phases form, how carbon is distributed and how readily the metal deforms. The same steel grade can therefore have different hardness, strength and toughness after different treatments—even when its bulk chemical composition stays the same.
For a grinding rod, shaft, pin or hydraulic rod, the useful question is which combination of surface and core properties the component needs. A harder surface may help resist wear; the material beneath it must still support the load. Understanding the connection between composition, processing and microstructure makes that distinction easier to specify and verify.
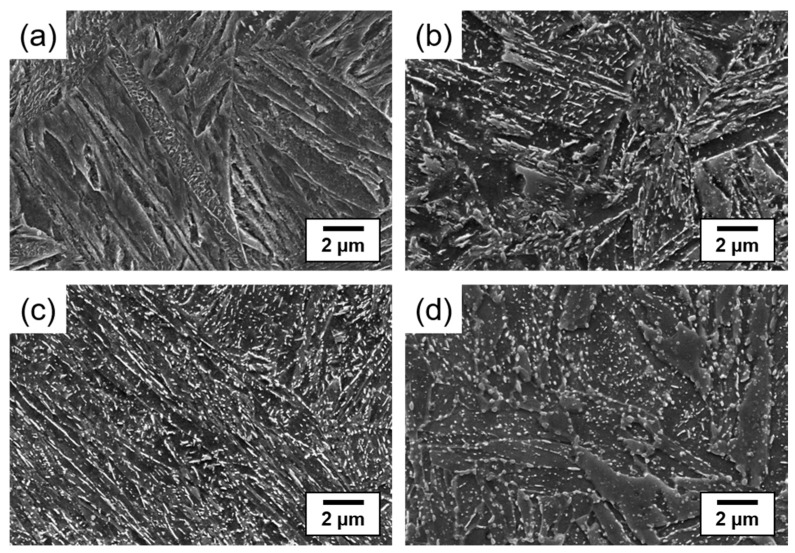
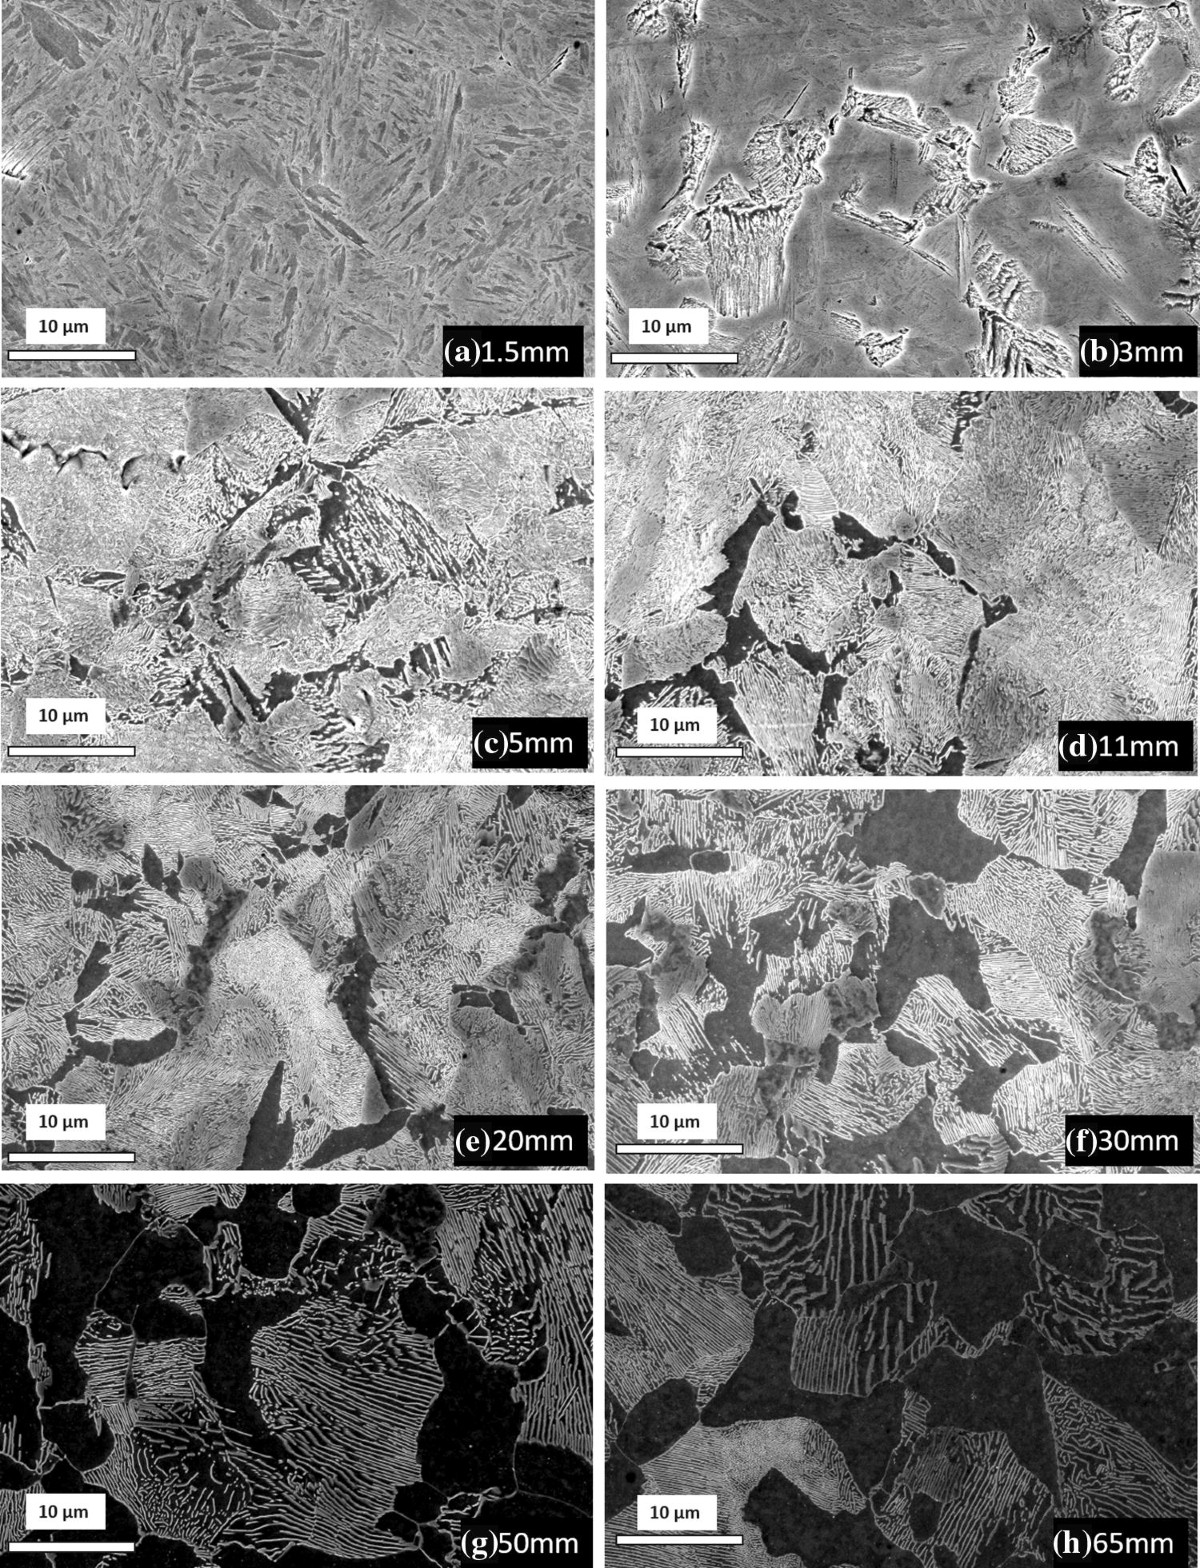
Figure 1. One steel, four observed treatment conditions
What to notice. The authors identify lath martensite in (a), elongated cementite in (b–c), and shorter carbide particles in (d). Compare the structures before asking what properties each condition delivers; the image itself is not a hardness or toughness test.
Select an image to open the full-size original and inspect its labels.
Key takeaways
- Grade and condition work together. A steel grade sets requirements within a material standard; delivery condition and heat treatment help define the supplied properties.
- Cooling history matters through the section. A round bar’s surface and centre can experience different cooling rates during the same treatment.
- Hardness and hardenability answer different questions. A local hardness reading does not establish how deeply a steel will harden.
- Choose a property balance. Strength, toughness, wear resistance and dimensional control need to be considered together for the actual component.
Why can the same steel grade have different properties?
The same grade can develop different properties because heat treatment changes its microstructure without necessarily changing its bulk chemistry. Phase identity, phase distribution, grain structure and defects within the crystals all influence deformation and fracture.
Ferrite has a body-centred cubic crystal structure. Austenite has a face-centred cubic structure and can accommodate more dissolved carbon. Heating into an appropriate austenitizing range prepares a structure that can transform along different paths during cooling. The required temperature and holding time depend on the steel and the intended process. See Cambridge’s steel microstructure notes. [1] [2]
Keep the property terms separate. Hardness describes resistance to localized indentation. Strength concerns the stress a material withstands: yield strength and tensile strength describe different points in a tensile test. Toughness concerns resistance to fracture and energy absorption under stated conditions. Hardness alone cannot supply all three answers. [3]
For measurement methods, see ISO 6508-1: Rockwell hardness and ISO 6892-1: room-temperature tensile testing. JOTAIN’s hardness and mechanical-property RFQ guide connects test methods to order requirements. [14] [15]
An illustrative shaft blank may undergo machining followed by final hardening. Its incoming condition serves machining; its final condition serves the shaft’s duty. Earlier test results cannot establish properties after another treatment. JOTAIN’s heat-treatment certificate guide explains how to connect the treatment record and product tests.
How does cooling change steel microstructure?
Cooling influences which transformations can occur before the steel reaches lower temperatures. Some transformations require time for atoms to redistribute; martensite forms through a rapid, diffusionless change in the parent austenite lattice. The result depends on both composition and thermal history. [1] [2]
Pearlite forms through the combined growth of ferrite and cementite, which appear as alternating layers in a suitable section. Reducing the layer spacing can increase strength, but this does not automatically produce an equivalent improvement in toughness. Bainitic structures offer other combinations of constituents and morphology; their properties cannot be ranked from the word “bainite” alone. [1] [4]
| Phase or microstructure | What it describes | Property significance |
|---|---|---|
| Ferrite | An iron-rich phase with limited carbon solubility | A relatively soft constituent; its grain structure and strengthening mechanisms still matter |
| Austenite | A phase that dissolves more carbon than ferrite | The starting phase for many hardening routes; some may remain after cooling |
| Cementite | Iron carbide, Fe₃C | A hard constituent whose amount and distribution influence behaviour |
| Pearlite | Ferrite and cementite growing together | Layer spacing and colony structure influence strength and fracture behaviour |
| Bainite | A ferritic microstructure, commonly with carbides; some steels retain carbon-enriched austenite | Properties depend on constituent distribution and transformation conditions |
| Martensite | A phase produced by a diffusionless transformation of austenite | Carbon and defect structure can provide high hardness; the as-quenched state may require tempering |
Table 1. These descriptions distinguish individual phases from structures containing several constituents. They are not guaranteed properties of a delivered bar. [1] [2] [4]
Figure 2. The lamellar structure of pearlite
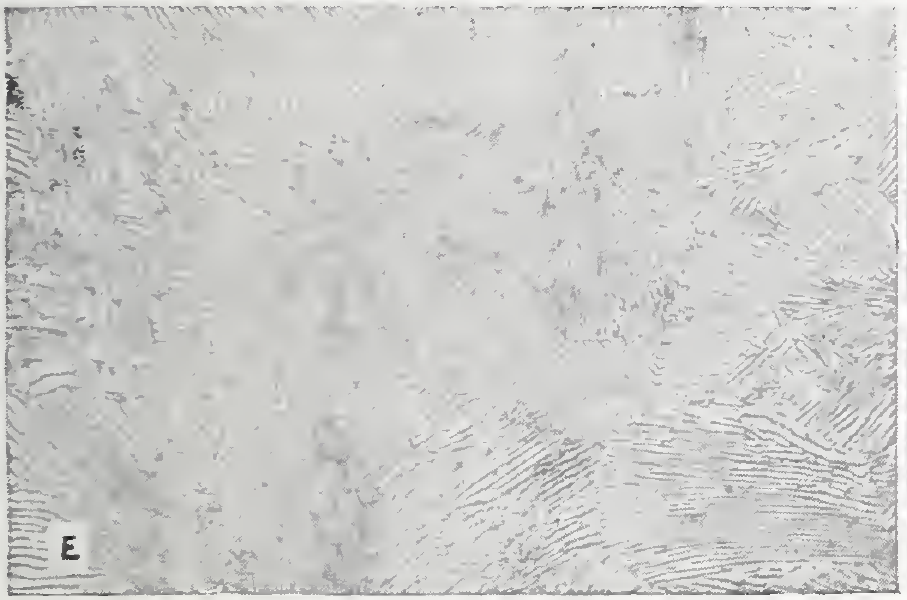
What to notice. Look for groups of alternating light and dark lamellae. Their direction changes between colonies. This historical optical image illustrates pearlite; screen dimensions do not preserve the original nominal magnification.
Select an image to open the full-size original and inspect its labels.
Carbon supersaturation contributes to the hardening of martensitic steel. However, retained austenite, prior structure and transformation history also matter. A microstructure name is a starting point for interpretation; a specified test establishes the property being accepted. [2]
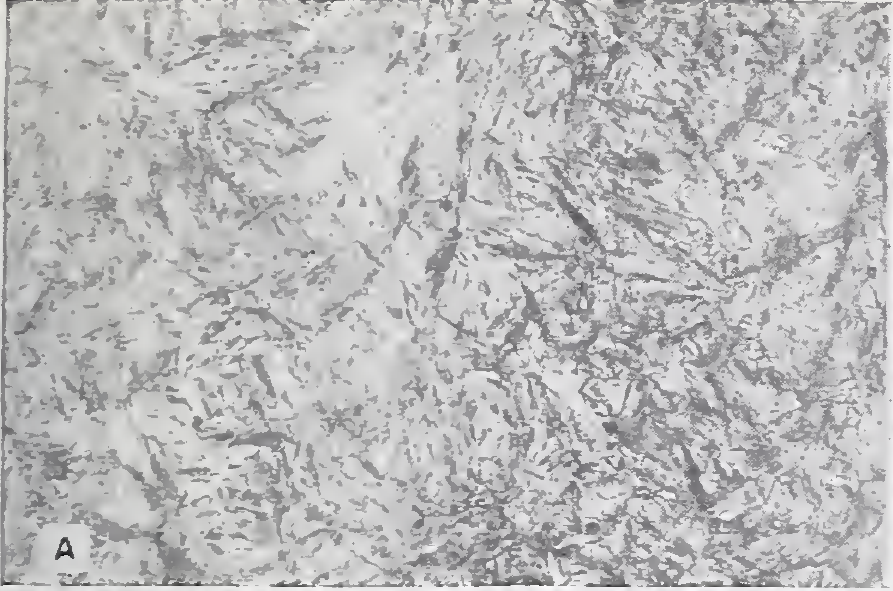
Figure 3. Martensite and bainite in historical optical micrographs
A · Martensite
E · Bainite
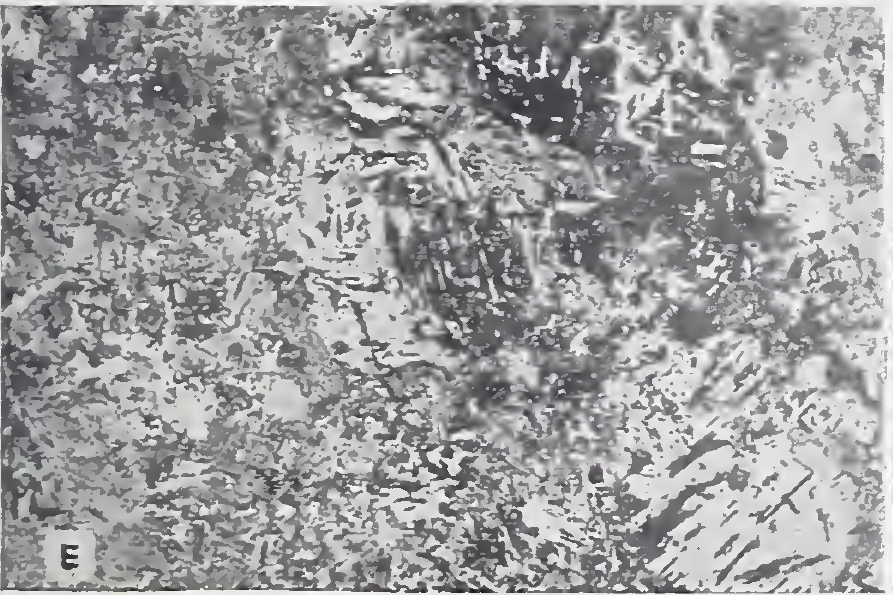
What to notice. Both structures can appear acicular in optical microscopy. Their identities here come from the source’s treatment history and interpretation; needle-like appearance alone is not a reliable identification rule.
Select an image to open the full-size original and inspect its labels.
What do TTT and CCT diagrams tell an engineer?
A time–temperature–transformation (TTT) diagram describes transformation during holds at specified temperatures. A continuous-cooling-transformation (CCT) diagram describes transformation during continuous cooling. Both relate time and temperature to structural changes for the material and starting conditions represented. [5] [6]
The familiar iron–carbon diagram shows phase relationships under equilibrium assumptions; it does not tell an engineer how quickly a quenched production bar transforms. TTT and CCT diagrams add the time dependence needed to understand competing transformation paths. [1] [5]
A CCT diagram is particularly useful for thinking about different positions in a bar. The surface and centre follow different thermal histories. Those histories can pass through different transformation regions, leaving different proportions of constituents within one section. Actual cooling need not occur at a constant rate. [6]
Read the diagram’s composition, austenitizing conditions and experimental basis before using its curves. A cooling rate illustrated for one carbon steel cannot be transferred directly to another grade or to every bar diameter. The video’s diagrams are teaching examples, not treatment schedules for JOTAIN products. [7]
Figure 4. A CCT diagram connected to measurements
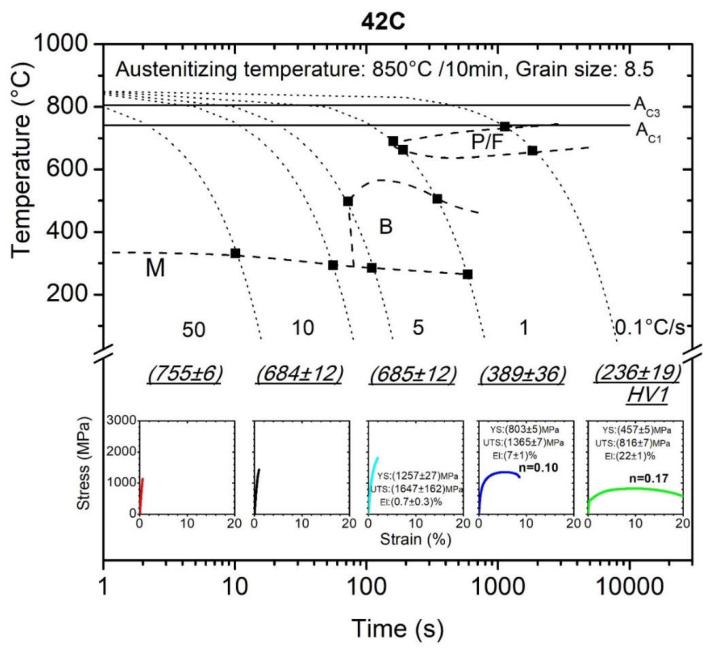
What to notice. Follow a dotted cooling path through the transformation regions, then compare its reported HV1 value. The lower plots report miniature tensile tests. These specimen-specific results do not set acceptance values for full-size bars or establish one universal CCT diagram for 42CrMo4.
Select an image to open the full-size original and inspect its labels.
What do annealing, normalizing, quenching and tempering change?
These processes change steel through different thermal paths. Annealing and normalizing can prepare or modify the starting structure; quenching can develop a hardened structure; tempering adjusts the condition produced by hardening. Their suitability depends on composition, geometry and the next operation, as outlined in ASM’s heat-treating guide. [3] [8]
| Process | Typical route or purpose | Practical implication |
|---|---|---|
| Annealing | A family of treatments used to soften or modify structure; full annealing commonly includes slow cooling | Specify the annealing condition needed for subsequent machining or forming |
| Normalizing | Austenitizing followed by air cooling | Can refine the structure; the result depends on grade and section |
| Quenching | Cooling austenitized steel fast enough to obtain the required hardened structure | Balance transformation response against cracking, distortion and section variation |
| Tempering | Reheating hardened steel below the range where austenite forms | Adjust the strength–hardness–toughness balance and reduce some effects of quenching |
Table 2. General process distinctions. No universal furnace temperature, holding time or property range follows from these names. [3] [8] [9]
For many hypoeutectoid carbon steels, full annealing produces a relatively coarse ferrite–pearlite structure. Normalizing commonly produces a finer structure and higher hardness than full annealing of the same steel, although composition and section size affect the outcome. Annealing does not always require full austenitization: subcritical annealing takes place below the lower critical temperature. [3] [8]
During tempering, carbon redistributes, carbides can precipitate and the defect structure evolves. This commonly reduces hardness while improving the usefulness of quenched steel. The relationship is not universally monotonic: secondary hardening and embrittlement mean that increasing tempering temperature does not always make a steel softer and tougher. [9]
The SEM comparison in Figure 1 makes one part of this change visible: the morphology of the carbides changes across the tested conditions. It does not establish a universal relationship between appearance, hardness and toughness.
For ordering implications, use JOTAIN’s QT, annealed and normalized steel-bar guide. It separates delivery condition from surface processing and identifies what the supplier’s tests need to represent.
What is the difference between hardness and hardenability?
Hardness is a property measured at a location. Hardenability describes a steel’s capacity to develop a hardened, martensitic structure through a section under specified cooling conditions. Two steels can achieve similar surface hardness yet have different hardening responses towards the centre. [6]
Carbon content strongly influences attainable martensitic hardness. Alloying elements and austenite grain size influence transformation behaviour and therefore hardenability. Greater hardenability can allow the required structure to develop at slower cooling rates, which becomes important as sections grow thicker. [6] [10]
Figure 5. Section size changes the normalizing response
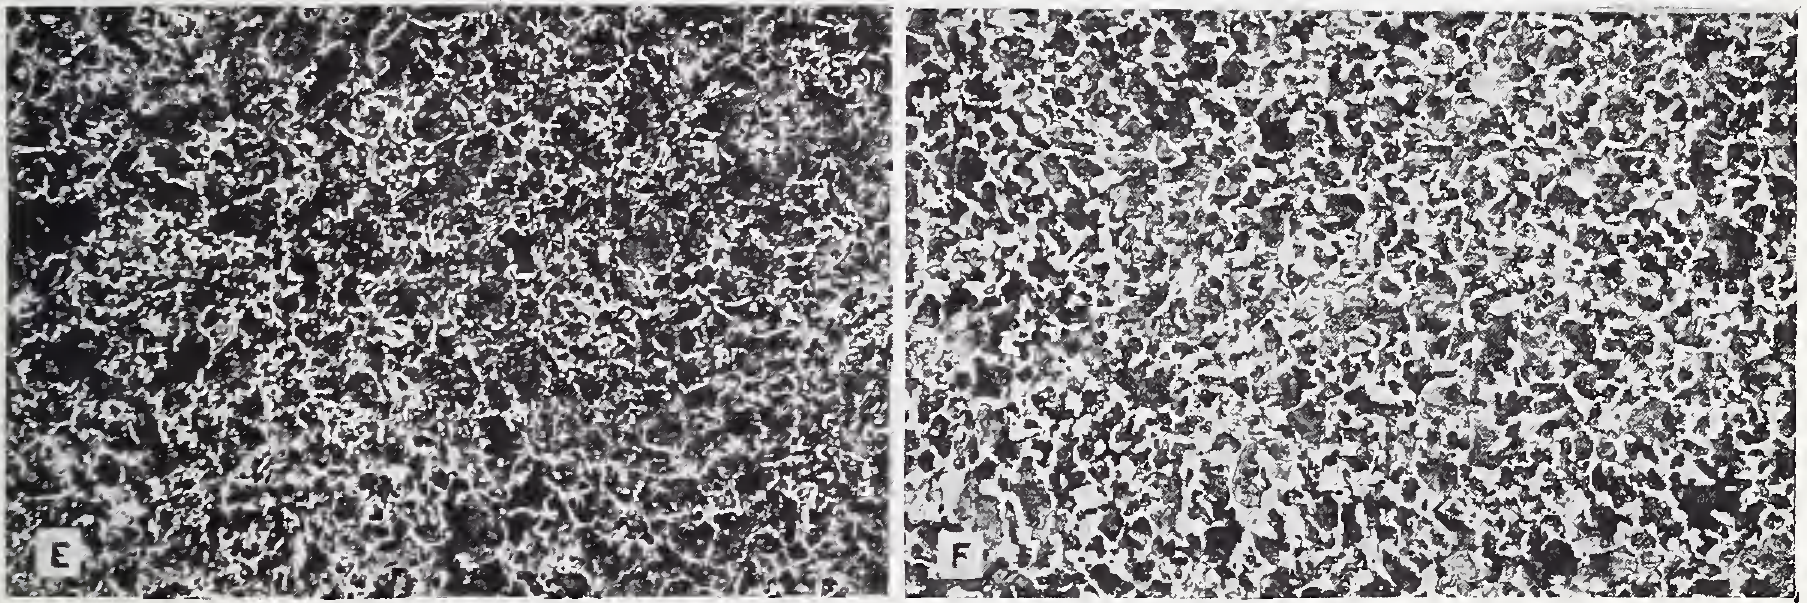
What to notice. Compare two different bar sizes, not the surface and centre of one bar. The source describes coarser pearlite and more free ferrite in the larger section. This is a normalizing comparison, not a measured quench-hardness profile.
Select an image to open the full-size original and inspect its labels.
An illustrative large shaft may need evidence from a specified radial position because its surface reading cannot establish its core condition. A pin’s hard layer and supporting core have separate jobs. JOTAIN’s 1045 vs 4140 shaft and rod comparison connects grade choice to these requirements.
JOTAIN’s Jominy and section-size guide explains how to connect hardenability evidence with an RFQ without treating a laboratory curve as a full-size acceptance test.
How do you read a Jominy test—and use it for grinding rods?
The Jominy end-quench test shows how a steel’s hardening response changes as cooling becomes slower along a standardized specimen. It helps compare hardenability when choosing material for a section. It does not directly measure the hardness distribution in a finished grinding rod. [10] [16]
From the furnace to a hardness curve
- Identify and prepare the specimen. Connect it to the steel heat and agreed method. ISO 642:2024 describes a specimen 25 mm in diameter and at least 100 mm long. Specify the applicable standard and edition rather than mixing procedures.
- Austenitize, then quench one end. A controlled water jet cools the end face. Positions farther along the specimen experience progressively slower cooling; heating and quenching conditions belong in the test record.
- Prepare the measurement surfaces. Grind suitable flats and measure hardness at the method’s defined positions, with preparation that avoids introducing a misleading surface condition.
- Plot hardness against distance. Keep the scale, distance units, individual results, specimen identity and test conditions with the curve.
This is an explanation of the principle, not a laboratory operating procedure. See ISO 642:2024, ASTM A255 and Cambridge’s illustrated end-quench demonstration. [10, 16, 20]
Figure 6. Where the Jominy specimen is measured
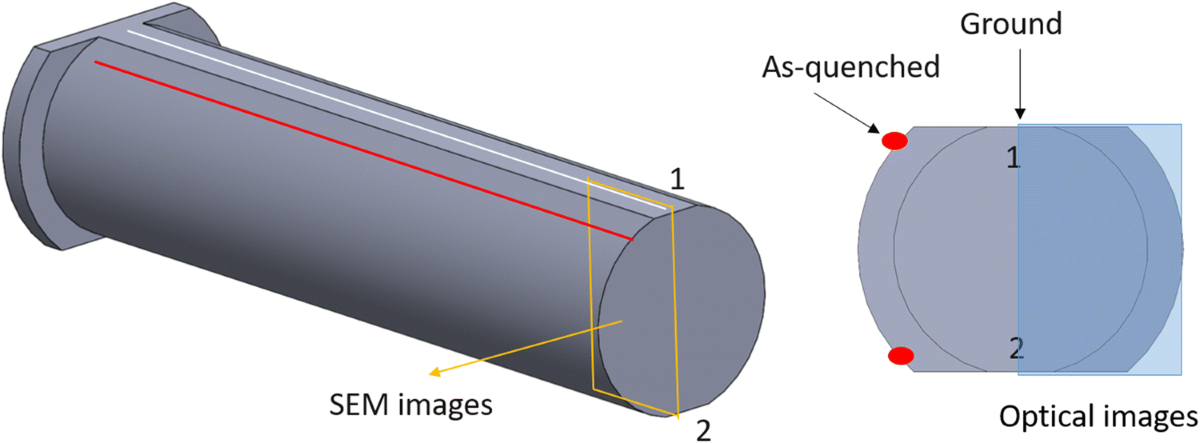
Swipe across the image to inspect its panels, or select it for the full-size original.
What to notice. Hardness is measured along the prepared flats. This is a specimen and measurement schematic, not a picture of the quenching apparatus or a section through a production grinding rod.
Select an image to open the full-size original and inspect its labels.
Read the curve together with the structure
When comparable steels retain a specified hardness farther from the quenched end, that supports a higher hardenability for that criterion. Comparing only the highest near-end number misses this distinction. First check that the curves use comparable test conditions and the same units. [6, 10]
Figure 7. Measured hardness along three Jominy specimens
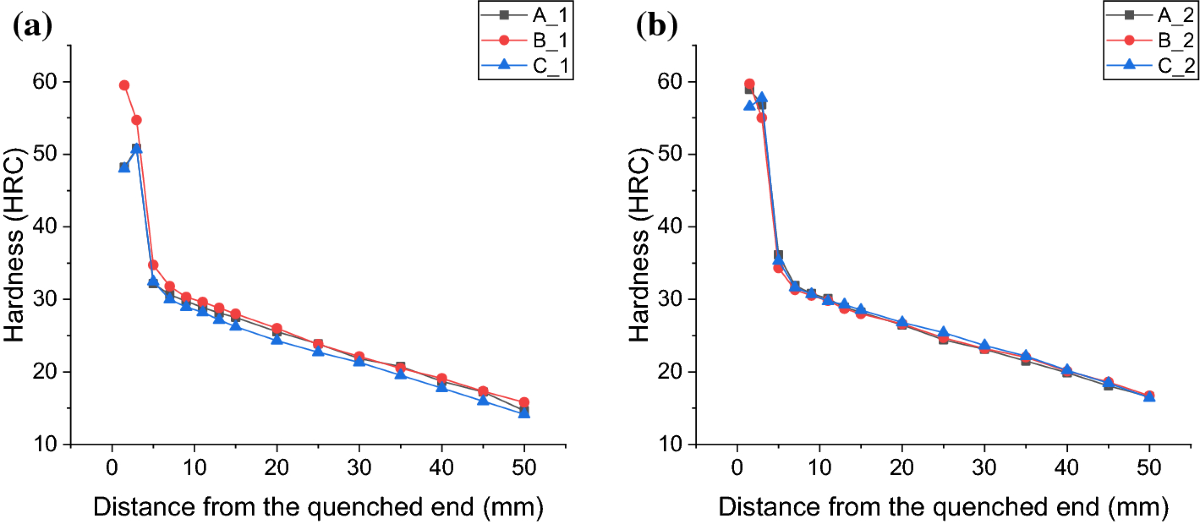
Swipe across the image to inspect its panels, or select it for the full-size original.
What to notice. The horizontal axis is distance from the quenched end; the vertical axis is the reported HRC result. A, B and C are specimens of the same steel, not three grades. The near-end differences are retained rather than smoothed away. These values are research observations, not grinding-rod acceptance limits.
Select an image to open the full-size original and inspect its labels.
Figure 8. The microstructure behind the Jominy response
Swipe across the image to inspect its panels, or select it for the full-size original.
What to notice. The authors identify martensite near the quenched end and increasing ferrite in the mixed structures farther away. Read this sequence beside Figure 7. The different distances show the response of CF53 under this test; they do not identify the microstructure of 65Mn, 42CrMoA or a JOTAIN rod.
Select an image to open the full-size original and inspect its labels.
Connect hardenability to the ordered rod
Jominy distance, radial depth and working-length position are three different coordinates. “20 mm from the quenched end” cannot be relabelled “20 mm below the rod surface.” Relating a laboratory curve to a production section requires an appropriate cooling and geometry analysis; the finished condition still needs representative tests. This is an engineering application of the hardenability principle. [6, 10]
For procurement, ask whether the supplied curve was measured on an identified heat or calculated using an accepted model. ISO 642 permits a calculated replacement only by agreement within a defined field of application. Then ask what finished-rod evidence covers the ordered diameter, heat treatment and final inspection stage. A curve alone does not verify the production quench, temper or straightening operation. [20]
Use JOTAIN’s Jominy and section-size RFQ guide for the evidence fields to put in the enquiry.
How does this apply to shafts, pins and hydraulic rods?
Industrial components often need a defined core condition together with specific surface properties. The material and process route should connect those needs to the working geometry, subsequent machining and inspection stage. The scenarios below illustrate that reasoning; they are not reported customer cases.
| Component scenario | Material question | Evidence to define |
|---|---|---|
| A shaft carrying bending or torque | Can the treated section provide the required strength and toughness? | Test position, delivery condition and relevant mechanical tests |
| A pin or journal exposed to contact wear | Is localized hardening needed above a supporting core? | Surface hardness, hardened depth and core requirement |
| A hydraulic rod with a finished surface system | How do the base material, hardening and coating work together? | Straightness, final dimensions, surface condition and separate coating checks |
Table 3. Engineering interpretation for discussion against a component drawing. The designer selects the acceptance requirements.
Induction hardening heats a selected surface region before quenching it. It relies on the steel’s existing composition and its response to austenitizing and cooling. A hard surface therefore still needs a specified depth, transition and supporting core. Carburizing instead adds carbon near the surface and is commonly followed by hardening. These routes solve different material and geometry problems. [11]
Nitriding introduces nitrogen to develop a hardened surface region and generally does not require a final quench. It is used with suitable steels, including alloy steels. Avoiding a final quench reduces one source of distortion; research on nitrided 42CrMo4 specimens nevertheless documents dimensional change. [12]
For a precision rod, specify when dimensions are accepted: after heat treatment, straightening, grinding or coating. JOTAIN’s straightness and surface-condition guide and chrome-plated rod guide separate these stages. A surface hardness result cannot establish coating performance, and a base-bar certificate cannot establish finished-rod geometry.
Figure 9. A surface that did not respond like the material beneath it
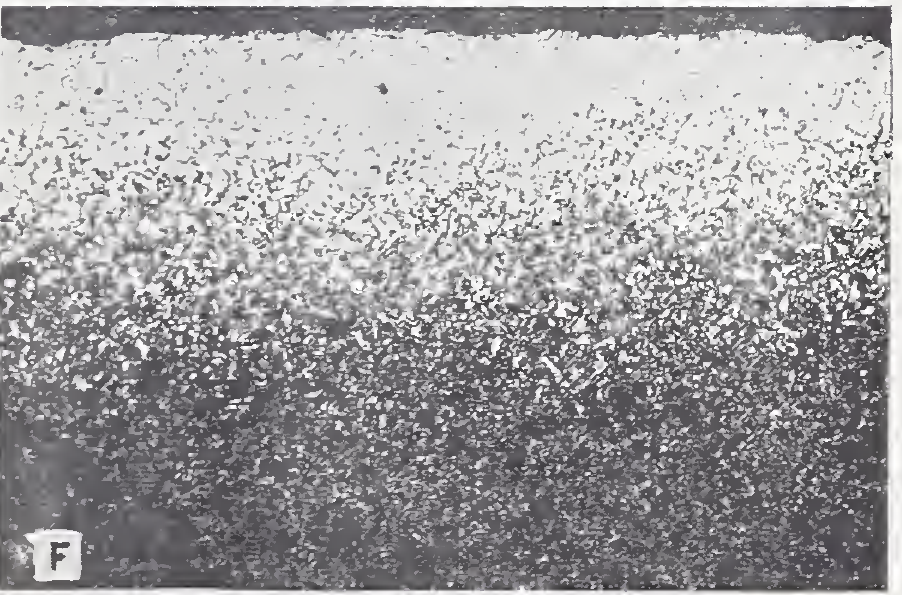
What to notice. The light band helps show why the surface condition and test location matter. Its depth cannot be accepted by measuring pixels on this resized historical image. A specified depth test and suitable preparation are separate requirements.
Select an image to open the full-size original and inspect its labels.
What does heat treatment need to deliver in a grinding rod?
For grinding rods, useful performance combines resistance to wear with the ability to withstand the mill’s loading without unacceptable breakage or bending. Hardness helps describe the material condition, but the highest surface reading is not a complete selection rule. A historical CIM paper by Pugh and Ma describes selective surface hardening with a lower-hardness core as one supplier’s approach to the wear–fracture tradeoff. That is evidence of a design approach, not a universal prescription for every rod. [21]
Figure 10. Grinding rods make section size and working length tangible
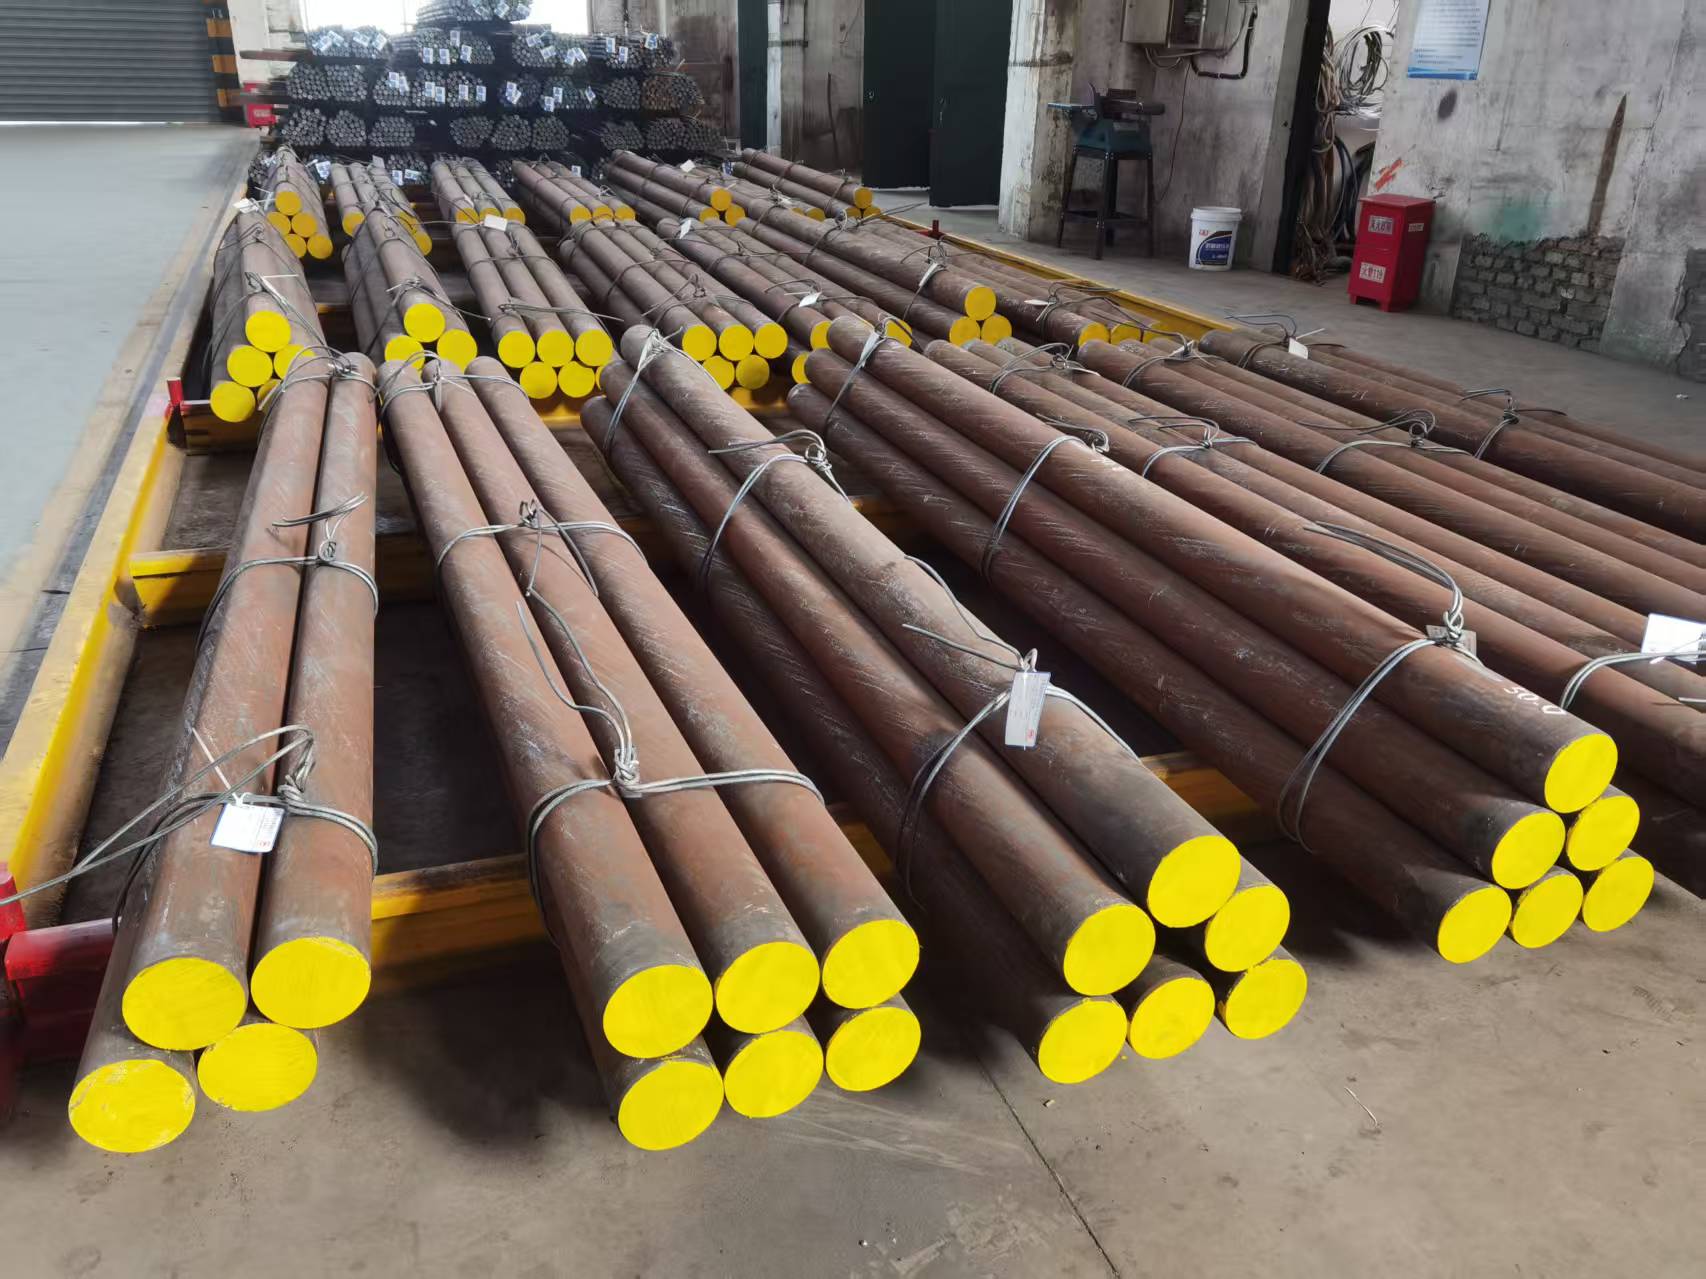
What to notice. The rods have both a cross-section and a long working length to consider. Painted ends and bundle appearance cannot establish the internal structure, hardness distribution or service performance.
Select an image to open the full-size original and inspect its labels.
Specify the surface, the core and the working length
Ask what structure and properties the proposed treatment is intended to produce at each relevant location. The tempering sequence in Figure 1 helps explain why an as-quenched condition and a tempered condition are different. The decarburized layer in Figure 9 shows why preparation and surface condition also deserve attention. Both are external examples; a grinding-rod qualification needs evidence from the declared material and route.
The following checklist is an engineering proposal for order review. It turns the heat-treatment discussion into separate, verifiable questions; target values and sampling frequencies remain application decisions.
| Question for the rod | Record to request | What it establishes |
|---|---|---|
| How does hardness change through the section? | Mapped surface, sub-surface, mid-radius and core readings on an agreed transverse sample; direct method and preparation stated | The measured locations in the represented section; a Jominy curve answers a different question |
| Does that condition represent the working length? | Defined longitudinal positions, end-zone treatment, rod identity and sampling basis | Which parts of the long rod are covered; an end coupon needs a stated basis for representing other positions |
| What accompanies the hardness result? | Metallography and toughness or impact results where ordered; surface examination and straightness checks | Separate evidence for structure, fracture-related behaviour, surface condition and geometry |
| Can the result be traced to the delivery? | Steel heat, treatment lot, final inspection stage and bundle identification | The connection between qualification, sampled product and shipped rods |
Table 4. Proposed grinding-rod review checklist. Agree methods, locations, acceptance criteria and the represented lot before production.
A trial may compare two material or treatment routes at the same nominal rod size. Treat a stronger Jominy response as useful material-selection information, then compare the actual finished rods. “Higher hardenability” does not by itself establish “better grinding rod.” See the grinding-rod hardness and heat-treatment guide and 65Mn versus 42CrMoA comparison for related ordering questions.
Judge the result in a controlled mill comparison
Before a trial, define the baseline, observation period and operating conditions to record: rod diameter and length, charge practice, feed characteristics, throughput and relevant mill settings. Track consumption, breakage, bending, removals and downtime separately. Relate each observation to the supplied heat and treatment lot, and record changes during the comparison. These are proposed trial controls, not reported JOTAIN test results.
This keeps three decisions clear: Jominy evidence informs hardenability; finished-rod inspection verifies the specified condition; a documented mill comparison evaluates performance in that operating window. For an enquiry, share the rod size, current material and condition, the main wear or failure concern, and the records available through the grinding-rod application route.
Frequently asked questions
Is harder steel always better?
No. Increasing hardness can help a wear-related requirement, but the component may also need toughness, machinability and resistance to cracking. Select the property balance for the loading and manufacturing route, then verify those properties separately. [3]
Is tempering the same as annealing?
No. Tempering usually adjusts a previously hardened structure below the range where austenite forms. Annealing covers a broader group of treatments for softening or structural modification. Their starting conditions, mechanisms and intended results differ. [8] [9]
Can surface hardness prove the core is adequately hardened?
No. The centre of a bar can cool differently and develop a different structure. Core acceptance requires evidence that represents the relevant position and treated section; a surface-only measurement cannot supply that evidence. [10]
Does nitriding prevent all distortion?
No. Nitriding generally avoids a final quench, but dimensional growth and distortion can still occur. The process, starting condition and geometry need to be considered, especially when the component has tight final tolerances. [12]
Does 20 mm on a Jominy curve mean 20 mm below a grinding rod surface?
No. It is a distance along the standardized specimen from its water-quenched end. A finished rod profile uses locations through the actual rod section. Connecting the two requires an appropriate cooling and geometry analysis, followed by representative product checks.
Can Jominy results predict grinding rod wear life or breakage?
Jominy results characterize hardenability. They do not measure abrasion loss, toughness, straightness or performance in a rod mill. Use them alongside finished-rod inspection and a controlled mill comparison with documented operating conditions.
RFQ checklist
- Steel grade and controlling material standard
- Bar diameter or relevant section size
- Intended component and service duty
- Required delivery condition and subsequent processing
- Properties to verify, test locations and required inspection records
Connecting the material to the supply route
JOTAIN’s published processing capabilities include quenching and tempering, normalizing, annealing, surface finishing, straightening and bar preparation. For a steel-bar enquiry, share the grade and standard, section size, intended component, required delivery condition and the properties that need verification. This connects the metallurgical purpose to a quotable supply stage.
References
The educational starting point is The Efficient Engineer’s video, published October 7, 2025. This article develops an independent explanation for industrial steel-bar applications and checks the mechanisms against the sources below.
- H. K. D. H. Bhadeshia, Interpretation of steel microstructure — phases, pearlite and structural interpretation.
- H. K. D. H. Bhadeshia, Martensite and Martensitic Phase Transformations — diffusionless transformation and martensitic structure.
- ASM International, Heat Treating: Subject Guide — property definitions and process overview; used qualitatively.
- H. K. D. H. Bhadeshia, Bainite microstructures — conventional and carbide-free bainitic structures.
- MIT OpenCourseWare, Kinetics Lecture 12: Grain Growth; Time-Temperature-Transformation Curves — the isothermal basis of TTT diagrams.
- University of Cambridge, AP3: Hardenability of Steel — continuous cooling, section response and hardenability.
- The Efficient Engineer, Understanding Steels and Heat Treatment — educational video, especially 00:14–22:15.
- ASM International, Subcritical Annealing and Normalizing, public abstract; Bodycote, Normalising — annealing scope and the effect of composition, section and cooling conditions.
- H. K. D. H. Bhadeshia, Tempered Martensite — tempering mechanisms, secondary hardening and embrittlement.
- University of Cambridge, The Jominy End Quench Test, with JOTAIN’s section-size interpretation guide — hardenability testing and its application limits.
- National Heat Treatment Centre, Induction Hardening — selective hardening and its distinction from carbon-enriching treatments.
- David Dobrocký et al., Change in Dimensions and Surface Roughness of 42CrMo4 Steel after Nitridation in Plasma and Gas, Coatings 12(10) (2022), 1481, open research text; Bodycote, Case hardening without subsequent hardening operation — measured dimensional change in identified specimens and the nitriding mechanism.
- Thomas G. Digges, Samuel J. Rosenberg and Glenn W. Geil, Heat Treatment and Properties of Iron and Steel, NBS Monograph 88, National Bureau of Standards (1966), Figures 5E, 12E–F and 15A/E/F — original micrographs reproduced from the NIST-hosted technical publication. See NIST’s technical-series reproduction policy.
- ISO, ISO 6508-1:2023 — Rockwell hardness test, test method — official public scope; full standard not reproduced.
- ISO, ISO 6892-1:2019 — Tensile testing at room temperature — official public scope; full standard not reproduced.
- ASTM International, ASTM A255 — Standard Test Methods for Determining Hardenability of Steel — official public scope for Jominy testing and hardenability determination.
- Sang-Gyu Kim, Jae-Yun Kim and Byoungchul Hwang, Effect of Tempering Temperature on Hydrogen Embrittlement of SCM440 Tempered Martensitic Steel — Materials 16(16) (2023), 5709; Figure 2 and methods. Open-access research, CC BY 4.0. Used for the identified specimen’s SEM comparison, not a JOTAIN performance claim.
- Kristýna Halmešová, Radek Procházka, Martina Koukolíková, Jan Džugan, Pavel Konopík and Tomasz Bucki, Extended Continuous Cooling Transformation (CCT) Diagrams Determination for Additive Manufacturing Deposited Steels — Materials 15(9) (2022), 3076; Figure 3 concerns conventionally manufactured 42CrMo4, not the additively manufactured comparison. Open-access research, CC BY 4.0.
- Suvi Santa-aho, Aki Sorsa, Mari Honkanen and Minnamari Vippola, Detailed Barkhausen noise and microscopy characterization of Jominy end-quench test sample of CF53 steel — Journal of Materials Science 55 (2020), 4896–4909; published online 12 December 2019. Figures 1–3 and methods; CC BY 4.0. CF53 laboratory specimens, not production grinding rods.
- ISO, ISO 642:2024 — Steel: Hardenability test by end quenching (Jominy test) — Official public scope. Identify the agreed method and edition; the full procedure and acceptance requirements are not reproduced here.
- R. W. Pugh and S. L. Ma, Heat Treated Grinding Rods — Canadian Institute of Mining, Metallurgy and Petroleum (1993), public abstract via OneMine. Supplier-authored historical study of selective hardening. Used to explain the surface/core tradeoff; no trial percentage or service-life promise is transferred to JOTAIN.
Inquiry support
Unsure which processing route to quote?
Send the drawing or RFQ with the grade, size, condition, processing, inspection, quantity, and destination. We can flag open points before quotation.