
A grinding rod hardness profile records hardness at defined positions from the surface to the center. It describes the material that will be exposed as the rod wears. For a complete specification, set the radial hardness requirements alongside rod diameter, microstructure, mechanical properties and mill operating conditions.
A customer recently asked JOTAIN Materials about a surface-to-core hardness gradient in wear-resistant rods. We provided technical direction on the requirement. For rod-mill buyers, the question is practical: how much of the working section should retain high hardness, and what properties are needed at the core?
1 / Grinding rods ready for supply.
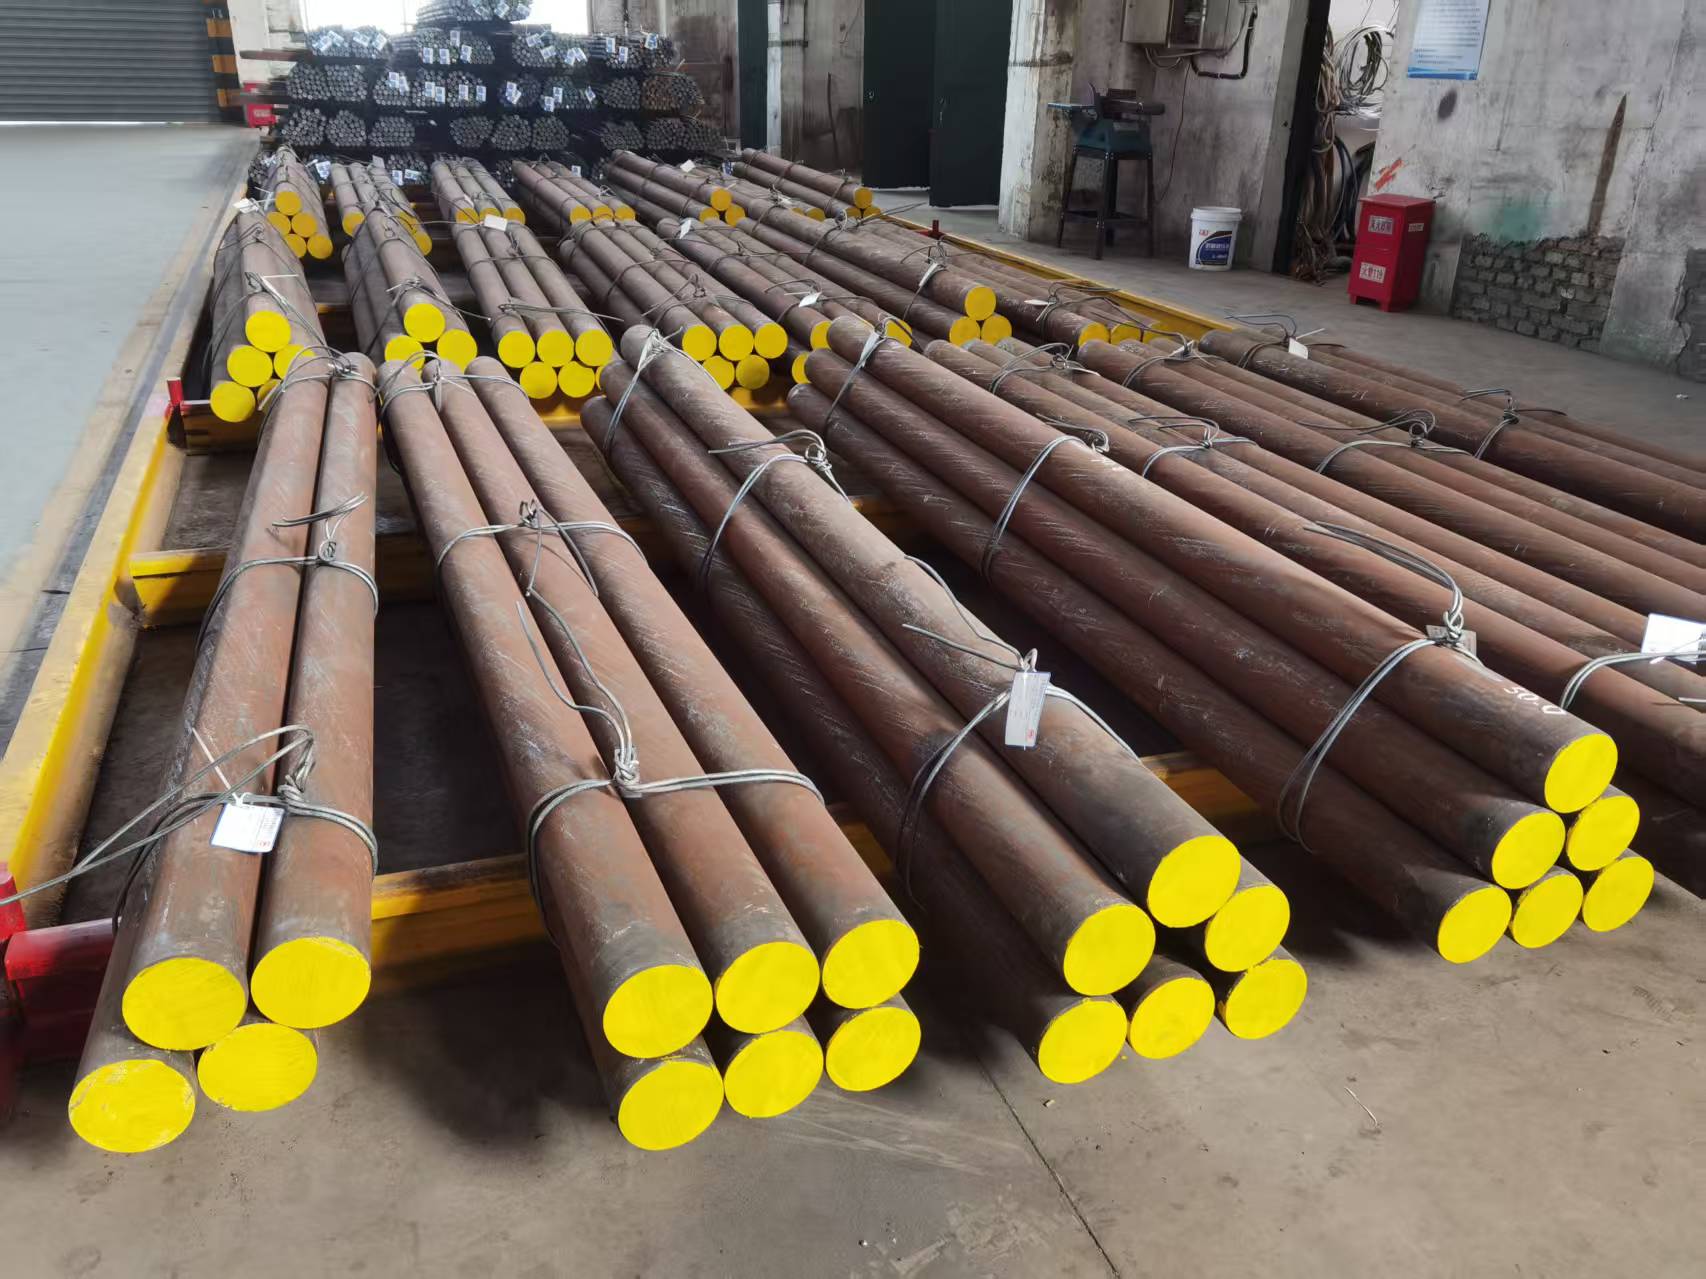
Specify the working section: diameter, radial hardness profile and mechanical requirements.
Select an image to open the full-size original and inspect its labels.
Key takeaways
- Matching surface HRC can conceal different internal hardness profiles.
- As the rod diameter decreases, wear exposes deeper material.
- Qualify radial hardness alongside microstructure, mechanical tests and mill performance.
What does a grinding rod hardness profile tell you?
Surface hardness gives the value at one location. A radial profile shows how that value changes through the cross-section. ASTM E18-25 makes this distinction in its guidance on local hardness measurements. For long, heat-treated grinding rods, record both the radial position and the position along the rod. ASTM E18-25, significance and use.
Buyers sometimes call this “stepped hardness.” The more precise engineering terms are surface-to-core hardness profile and radial hardness distribution. Specify measurement positions and acceptable ranges to describe both gradual transitions and steep changes in hardness.
Three questions make a profile useful:
- How far into the section does the intended high-hardness region extend?
- What material and microstructure lie beneath it?
- How are wear, bending and fracture performance checked alongside hardness?
Same surface hardness, different material underneath
Arnett and Bruner’s grinding-rod patent reports a useful comparison on 89 mm diameter rods. Samples 2 and 3 both measured 63 HRC at the surface. At 20 mm below the surface, the readings were 44 HRC and 60 HRC—a 16-point difference hidden by the identical surface results. EP 0336090 B1, 1994, pp. 3–4.
2 / Same surface hardness, different internal profiles.
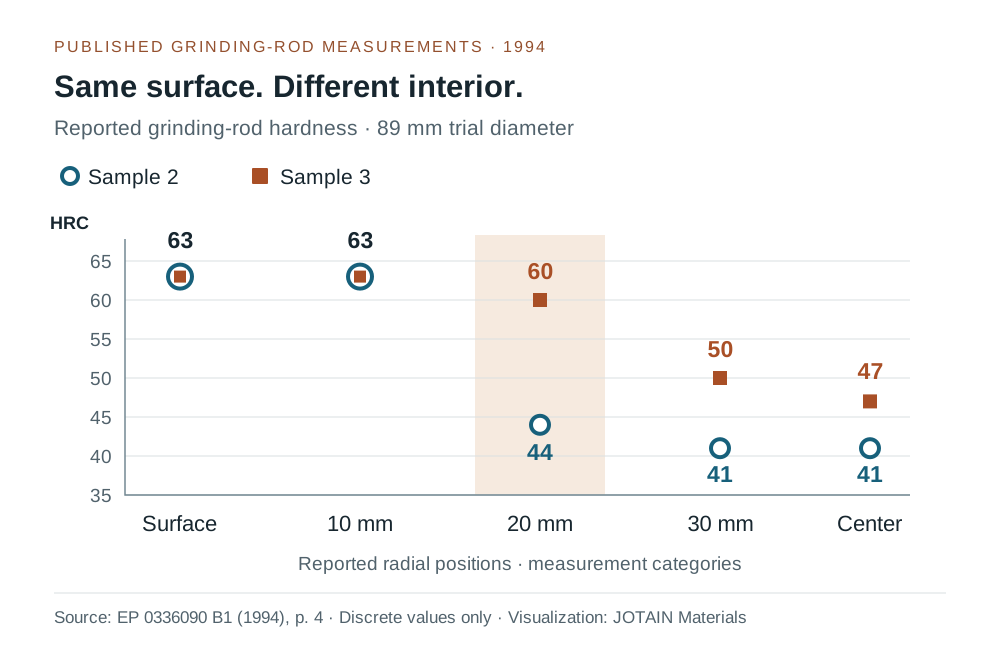
Swipe across the image to inspect its panels, or select it for the full-size original.
At 20 mm below the surface, the reported readings differ by 16 HRC points.
Select an image to open the full-size original and inspect its labels.
| Reported radial location | Patent sample 2, HRC | Patent sample 3, HRC |
|---|---|---|
| Surface | 63 | 63 |
| 10 mm | 63 | 63 |
| 20 mm | 44 | 60 |
| 30 mm | 41 | 50 |
| Center | 41 | 47 |
When comparing offers, request the full radial profile. Two rods with the same surface HRC can expose substantially different material as their diameters decrease.
What does wear expose below the surface?
Take a cylindrical rod worn uniformly from 80 mm to 60 mm diameter. Wear has removed a 10 mm radial layer, because the diameter decreases on both sides of the section.
For unchanged length and density:
- Radial material removed = (80 − 60) ÷ 2 = 10 mm.
- Cross-sectional area remaining = (60 ÷ 80)² = 56.25%.
- Material removed under these assumptions = 43.75%.
3 / Wear exposes the material below the original surface.
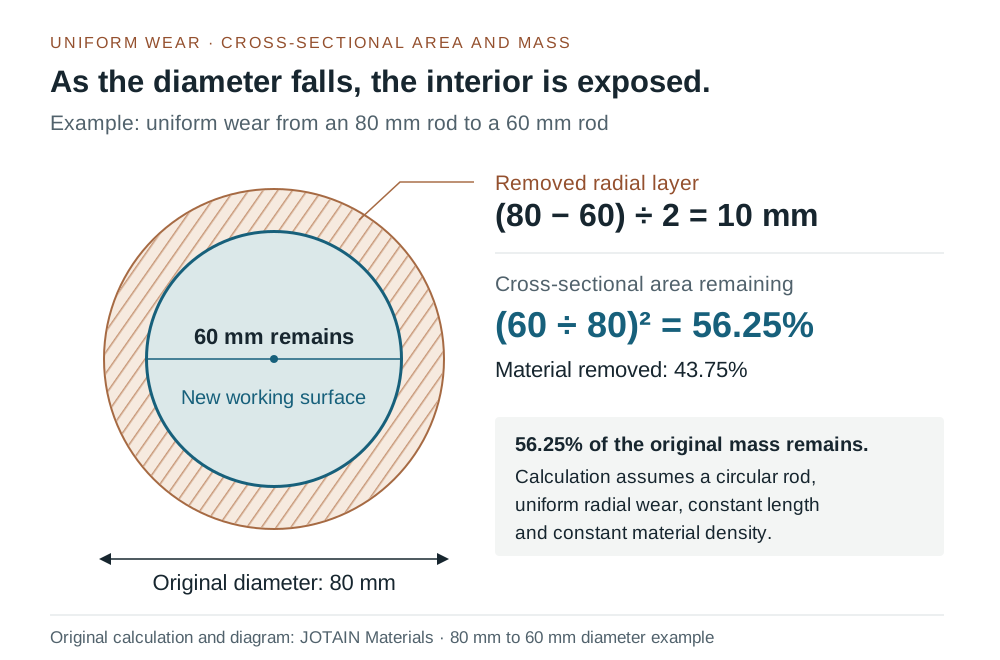
Swipe across the image to inspect its panels, or select it for the full-size original.
A 20 mm decrease in diameter removes a 10 mm layer from the radius.
Select an image to open the full-size original and inspect its labels.
Compare the depth of the high-hardness region with the diameter range used in the mill. A shallow hardened layer will be consumed earlier than a deeper one, even when the initial surface readings match.
Inspect recovered rods for taper, uneven wear, bending and fracture. Together with the initial hardness profile, those observations show which regions of the section carried the service load and how they wore.
Is a hard surface and softer core always better?
The right profile depends on the duty. A hard outer region can serve the wear requirement, while the core must carry the mechanical loads imposed by the mill. Select both through the steel’s microstructure, the heat-treatment route and relevant impact or bend-test results.
Pugh and Ma describe selective surface hardening with a lower-hardness core in their 1993 CIM paper on heat-treated grinding rods. Their published abstract documents the use of this approach in a mill-development programme. Heat Treated Grinding Rods.
For a proposed through-hardened rod, ask how much radial variation actually remains. For a surface-hardened rod, ask how the hardness changes below the outside region. In either case, a treatment label is only the start of the specification.
Why the microstructure belongs beside the hardness number
Tong and colleagues investigated heat-treated 65Mn steel in an open-access laboratory study. Their microscopy and wear results show why hardness should be interpreted with microstructure, rather than treated as a stand-alone ranking of wear resistance. Tong et al., 2021.
4 / Solution-treated 65Mn: microstructure and grain-size distribution.
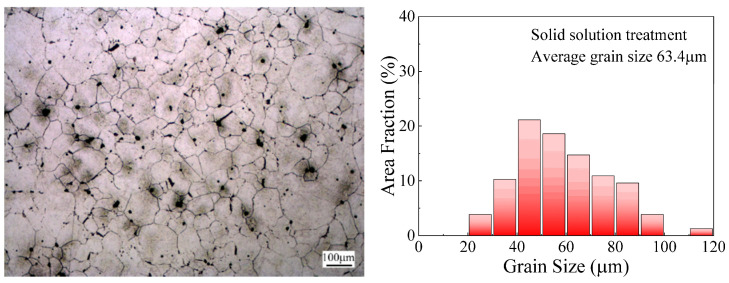
The 100 µm scale bar connects the micrograph to the reported grain-size distribution.
Select an image to open the full-size original and inspect its labels.
In the same study, the four conditions shown below produced wear losses of 52, 46, 11 and 9 mg. Their hardness ranking did not follow the wear-loss ranking throughout. The researchers examined the combined effects of hardness and grain refinement. Tong et al., section 5.3 and Figure 17.
5 / Wear loss, hardness and grain size in four 65Mn conditions.
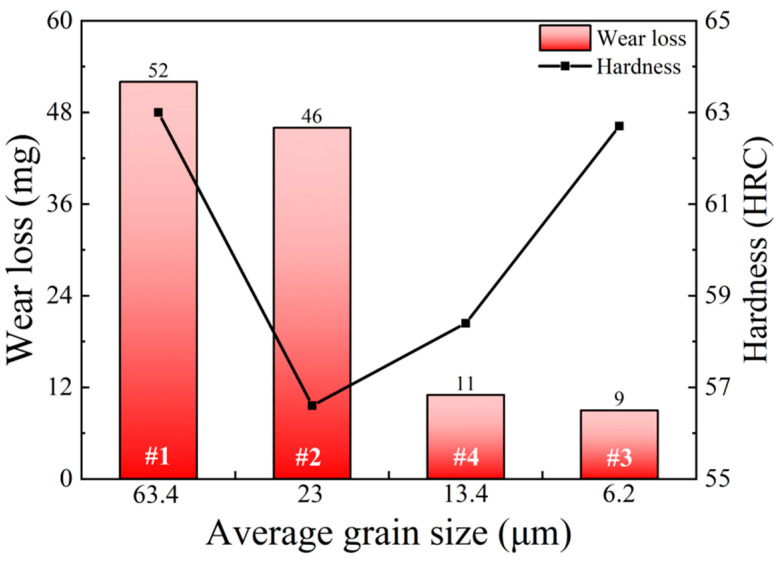
Wear-loss ranking and hardness ranking differ across the four laboratory conditions.
Select an image to open the full-size original and inspect its labels.
For grinding-rod qualification, examine the structure behind the hardness readings. Specify the proposed grade and full rod diameter, then connect the radial results to the heat-treatment condition and representative metallography.
How should a radial profile be verified?
Start with a sample whose identity and location are known. A polished cross-section has little purchasing value if nobody can connect it to the heat, treatment lot, rod diameter and position along the rod.
Agree the inspection plan before comparing results:
- Locate the section. Record the distance from the rod end and the orientation of the cut. An end section is not automatically representative of the working length.
- Prepare without obscuring the question. Document material removed during preparation and control cutting or grinding damage. Distinguish the supplied outer surface from a prepared subsurface.
- Map the measurements. Name the radial positions, hardness method, spacing, number of readings and inspection condition. Report individual results and applicable acceptance ranges.
- Keep the lot connection. Record sample identity, equipment verification, treatment condition and the agreed sampling and retest rules.
Use the selected test standard to set preparation and measurement requirements. NIST’s Rockwell guide explains the effects of specimen preparation, support and alignment on the readings. NIST SP 960-5.
6 / Specimen preparation and hardness testing.
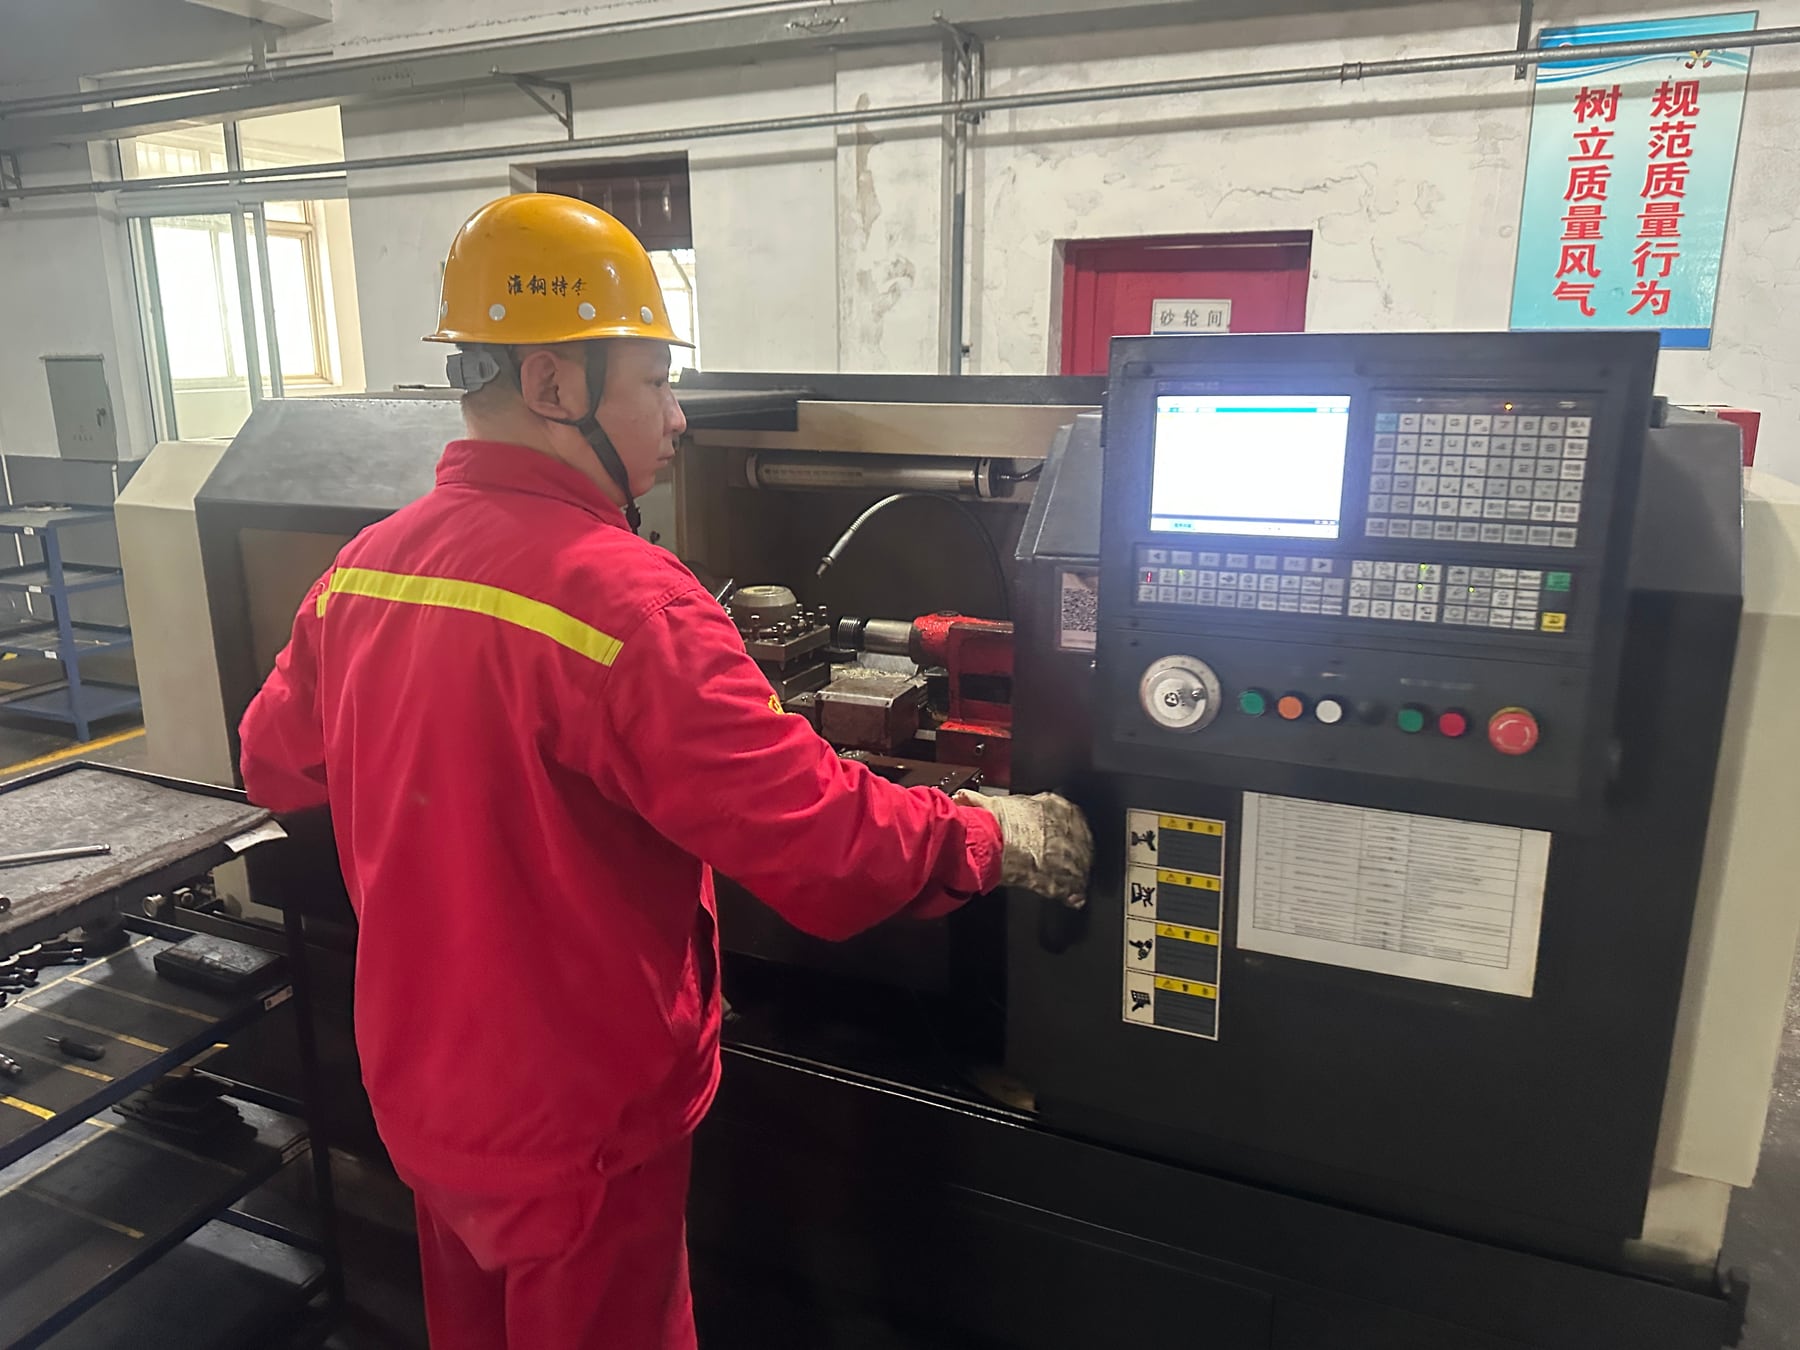
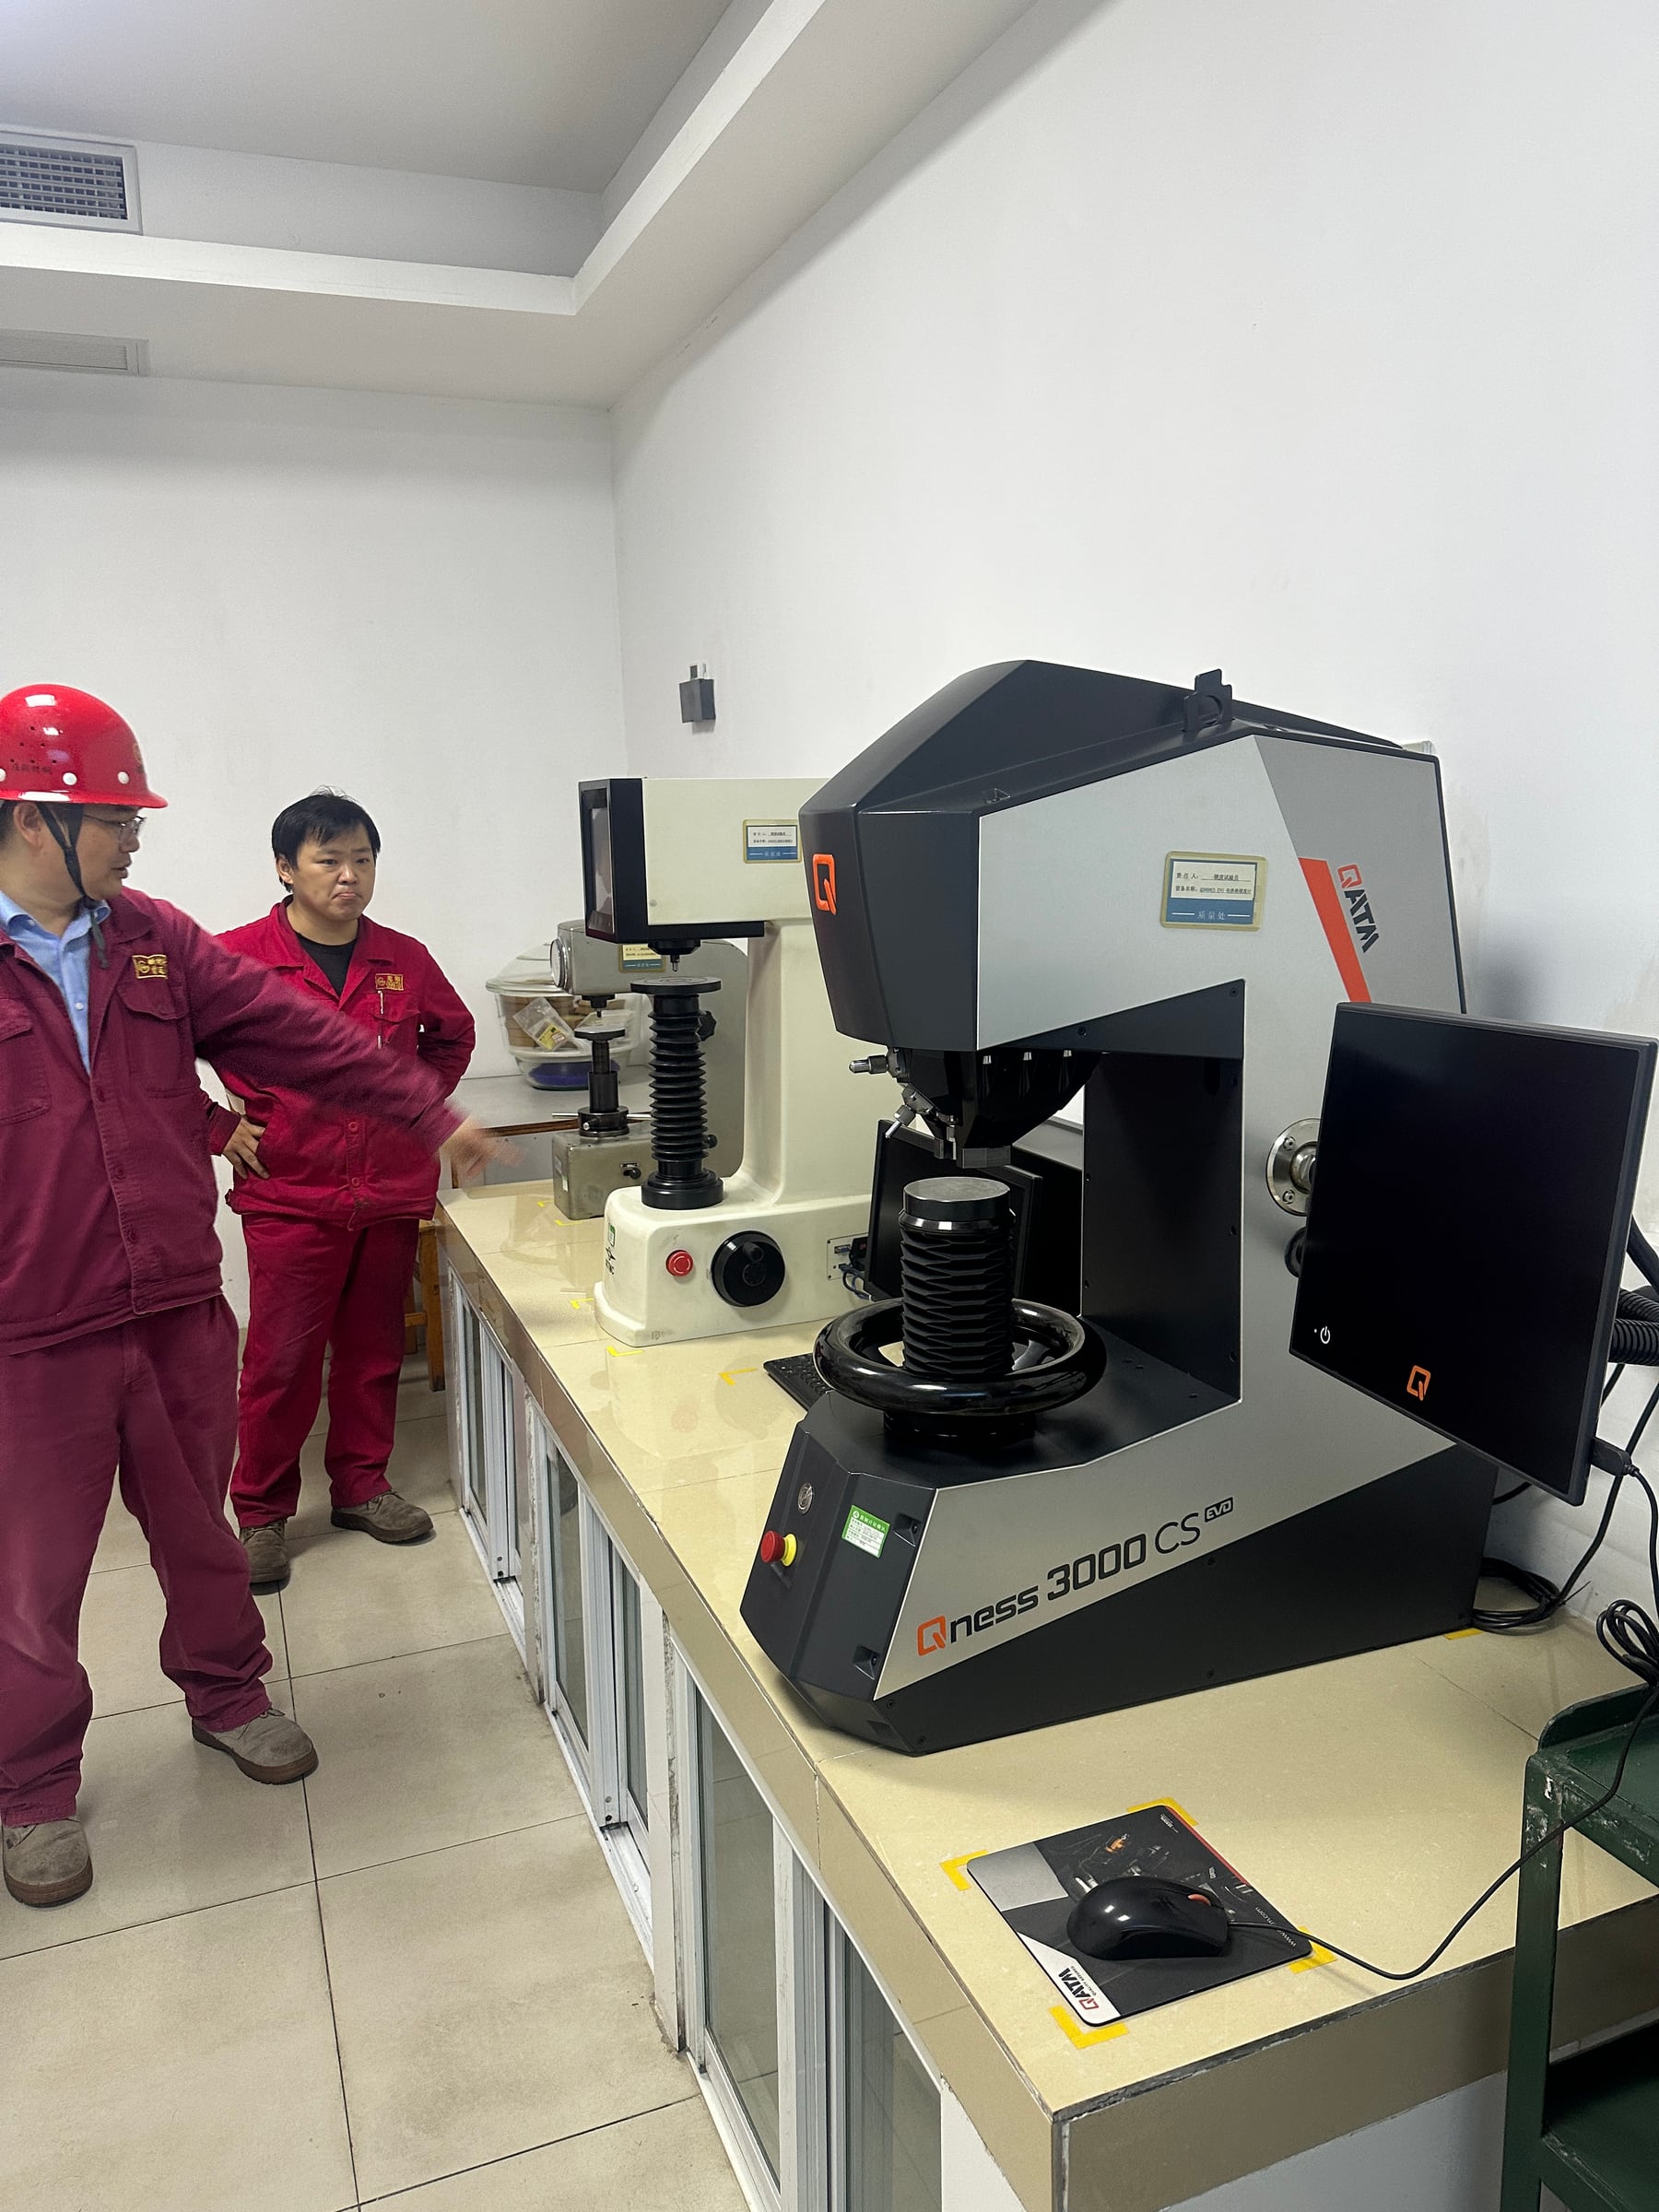
Connect every sample and measurement position to the heat and treatment lot.
Select an image to open the full-size original and inspect its labels.
Two common shortcuts need particular care:
- Converted hardness is not a direct measurement. ISO 18265:2013 limits how conversions should be interpreted; a converted number should not silently replace the agreed test method. ISO 18265:2013.
- A Jominy curve is not a grinding-rod cross-section. ISO 642:2024 uses a standardized end-quench test specimen. Its distance from the quenched end is not the radial depth in a production rod. ISO 642:2024.
For the detailed inspection checklist, see grinding rod hardness testing and heat treatment.
What must be checked beyond hardness?
A rod needs to survive the mill while it is being consumed. Treat wear loss, bending and fracture as separate observations. A favourable hardness profile cannot replace mechanical qualification or inspection of removed rods.
Where impact testing is specified, record specimen location, orientation, size, notch geometry and test temperature. Where a full-rod bend test is used, record the actual diameter, span, loading arrangement and acceptance basis. These tests answer different questions; neither should be replaced by a generic statement that the core is “tough.” ASTM A370 covers mechanical testing of steel products, while the applicable product specification or agreed qualification plan must define what is required. ASTM A370-26.
7 / Impact testing.
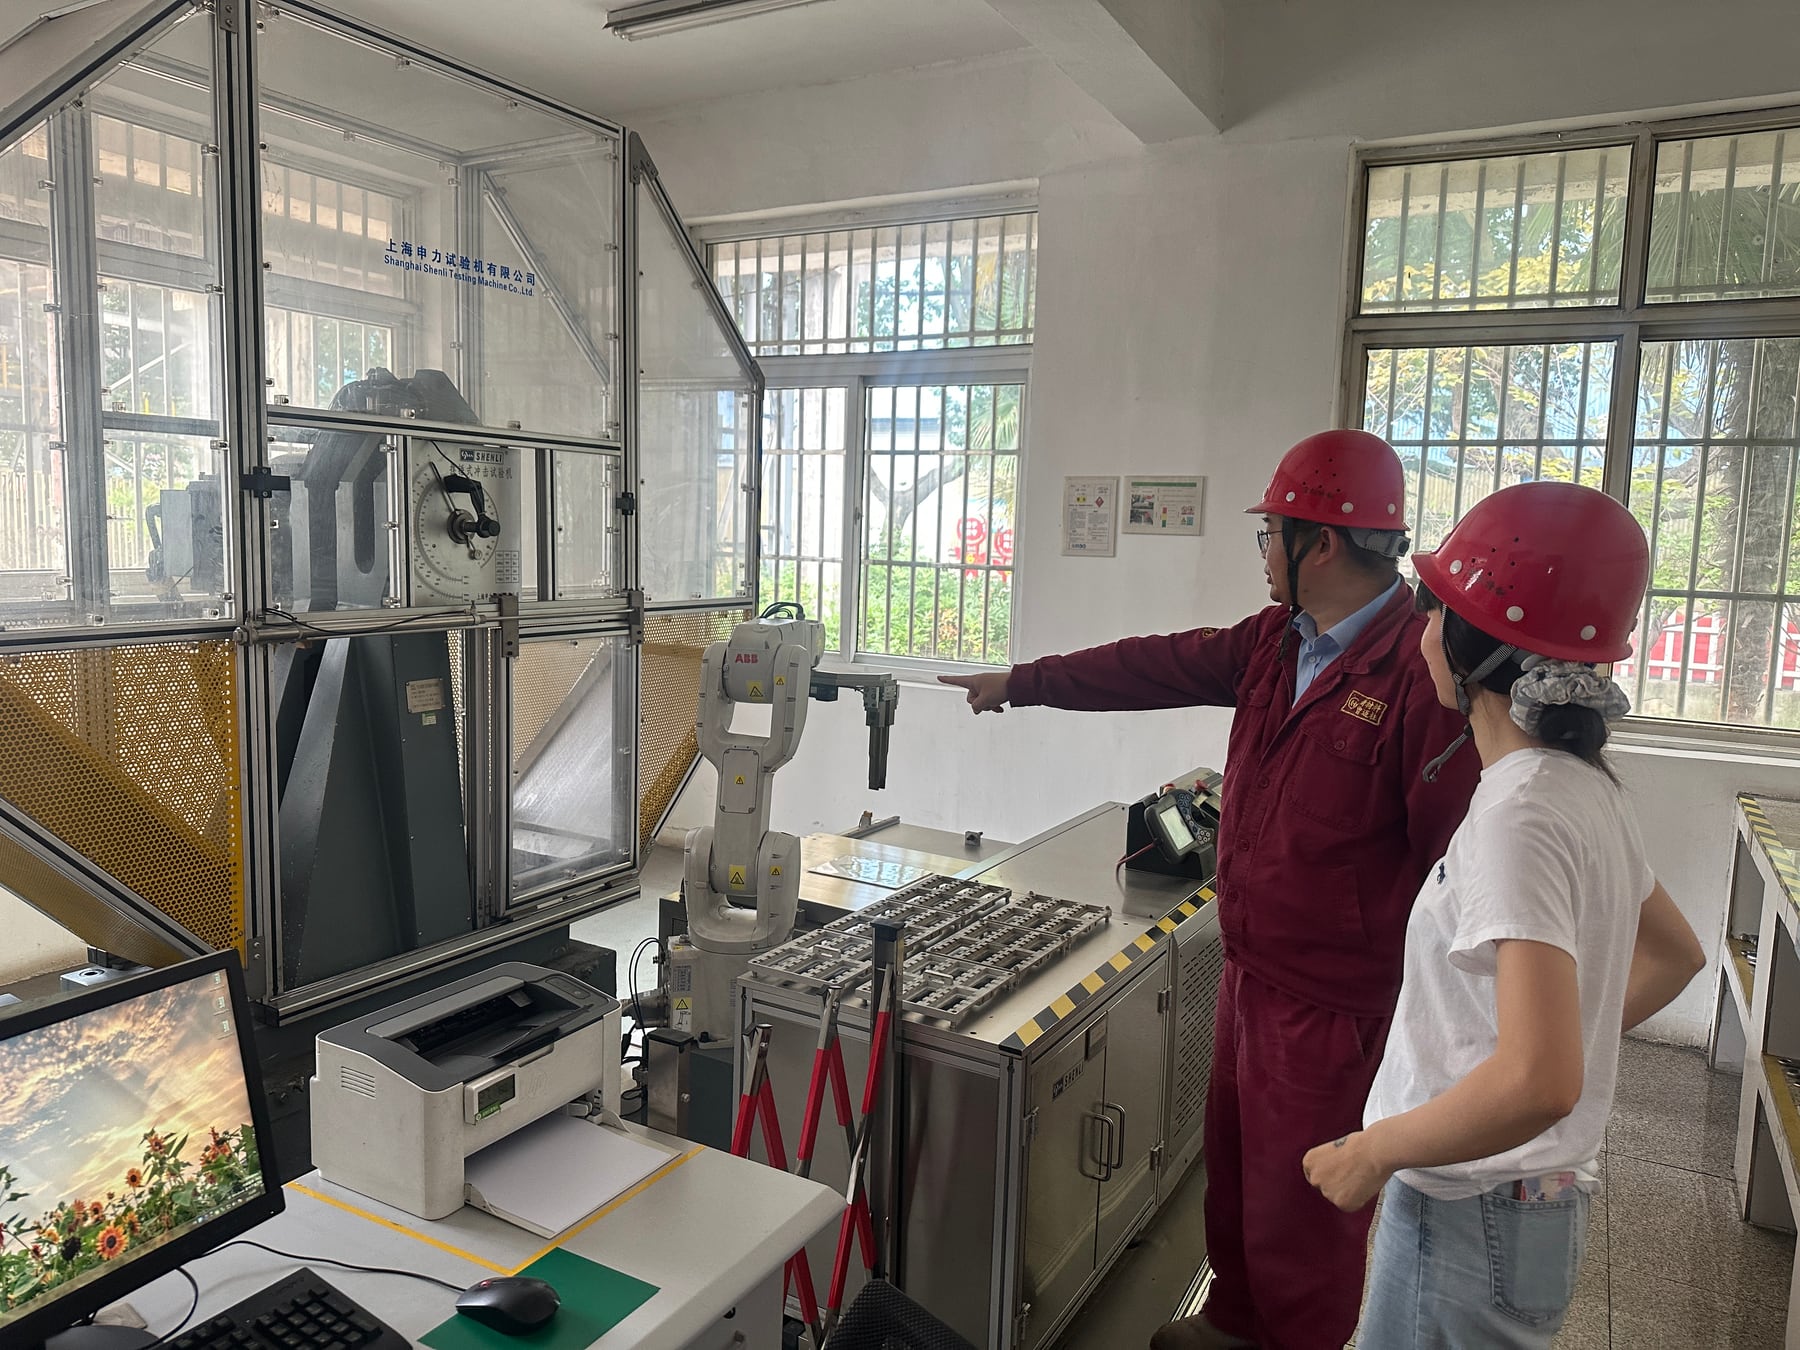
Assess mechanical performance alongside the radial hardness measurements.
Select an image to open the full-size original and inspect its labels.
The mill remains the performance test
Laboratory results become commercially meaningful when they are connected to comparable operating conditions. An archived U.S. Bureau of Mines investigation measured corrosion in operating grinding equipment, including an iron-ore rod mill. The report is a useful reminder that the environment is part of the experiment, not background detail. Isaacson, McDonough and Maysilles, RI 9166, 1988.
8 / Measuring corrosion in an operating rod mill.
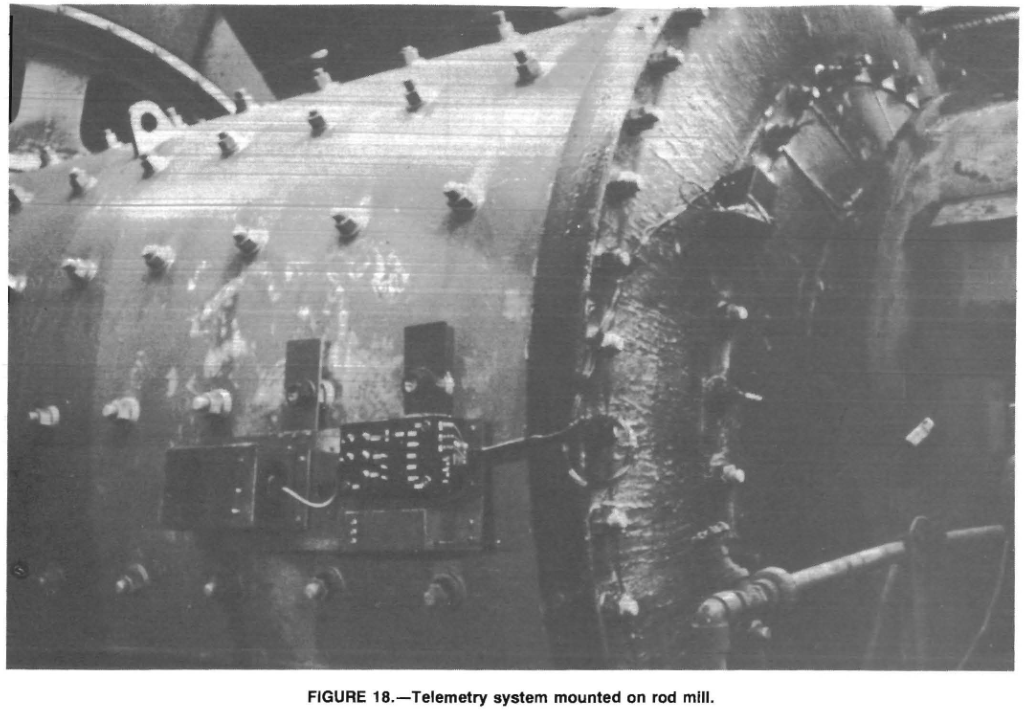
Record mill conditions and recovered-rod observations with the consumption results.
Select an image to open the full-size original and inspect its labels.
For a comparison trial, agree the ore and feed-size basis, throughput, mill settings, rod charge and make-up practice, trial duration and removal criteria. Record dimensions and photographs of recovered rods at defined positions, alongside breakage and bending observations.
State exactly how consumption is calculated. Rod additions per tonne over a short transition period are not automatically the material worn away: changes in the mill charge inventory can distort the comparison. Define the mass balance and whether the denominator is dry metric tonnes. Keep abnormal removals and downtime visible rather than hiding them inside one favourable consumption number. The grinding rod wear-rate and consumption-trial guide develops that comparison in detail.
Turn a hardness-gradient enquiry into a usable specification
JOTAIN Materials manufactures and processes steel bars. For a grinding-rod enquiry, we start with the service problem and turn it into material, heat-treatment and inspection requirements. The profile must be practical to manufacture and straightforward to verify.
Include these six items in the enquiry:
| Decision | Information to provide or agree | Evidence to request |
|---|---|---|
| Service problem | Excessive wear, bending, breakage or a combination; operating conditions | Removed-rod photographs, operating history and a defined baseline |
| Rod geometry | New diameter, length, dimensional tolerances and removal practice | Drawing or dimensional requirement; recorded worn-rod sizes |
| Radial profile | Surface and internal positions, target ranges and permitted variation | Location map, individual readings, scale and test method |
| Material and treatment | Proposed grade, heat-treatment condition and qualification scope | Heat identity, process-lot link and representative microstructure where required |
| Mechanical performance | Relevant impact and/or bend tests with agreed conditions | Actual test reports and acceptance criteria, not hardness-based assumptions |
| Mill comparison | Consumption basis, charge inventory, trial window and failure tracking | Comparable trial records, wear observations and recorded deviations |
Send JOTAIN the rod dimensions, working conditions, available hardness reports and clear photographs of used rods. Put the service problem, radial profile and verification requirements on the same brief. Start a grinding-rod technical review with JOTAIN.
The objective is a rod that wears predictably through its usable section and meets the mill’s mechanical demands. A surface hardness number is one input—not the whole specification.
For the commercial enquiry, use the heat-treated grinding rod supply page and include the required diameter, length, test locations and report format.
Can two grinding rod hardness reports be compared?
Compare the measurement conditions before ranking two hardness results. A report needs the rod diameter, material and treatment lot, test method and scale, sampling position, preparation and individual readings. Matching surface numbers alone leaves the radial profile and lot variation unresolved.
When one offer reports HBW and another HRC, ask for results obtained by the same agreed direct method. ISO 18265 limits the use of conversions to their material-specific context; converted values should not replace the selected direct test. Keep the original scale and conversion basis visible if a conversion is included for reference. [6]
If a result is disputed, retain the original readings and sample identity. Follow the agreed verification and retest procedure before deciding whether the difference comes from measurement conditions or the supplied material. A repeat test should remain connected to the first report. [5]
The grinding rod hardness testing and heat-treatment guide sets out the method, lot, certificate and retest fields to settle before quotation.
| Report mismatch | Information to request | Comparison status |
|---|---|---|
| Direct HRC versus converted HBW | Original readings, direct test method and any conversion source and material scope | Do not rank converted and directly measured results as equivalent evidence. |
| Surface reading versus core reading | Section sketch, depth or radial position, longitudinal location and preparation | Compare matching locations; use the full profile for the section assessment. |
| Different diameters or treatment lots | Finished diameter, heat and process-lot identity, sampling plan and treatment condition | Retain separate populations until the comparison basis is agreed. |
| Average alone versus individual readings | All readings, sample locations, sample count and handling of outliers or retests | Check the spread and sampling coverage before comparing averages. |
Frequently asked questions
What is the difference between surface hardness and core hardness?
They describe different locations in the rod. Surface hardness is measured at a defined outer location; core hardness is measured at a defined internal location, often the center. A radial profile adds intermediate measurements so that the transition between them is visible.
Does a hardness gradient mean a defective grinding rod?
No. A gradient may be an intended consequence of the material and heat-treatment route. Acceptance depends on the agreed profile and performance requirements, not on whether every radial reading is identical.
Does a softer core mean better toughness?
Assess core toughness through its microstructure and relevant impact or bend-test results. Record specimen location and test conditions with those results, then compare them with the mechanical requirements for the rod’s mill duty.
How should a buyer specify a grinding rod hardness gradient?
State the rod diameter, proposed grade, measurement depths, hardness scale and acceptable range at each location. Add sampling positions along the rod, mechanical-test requirements and lot traceability. Select the target profile for the mill duty and confirm it through qualification.
Can a hardness profile predict grinding-rod consumption in kg/t?
Not on its own. Consumption also depends on operating conditions, ore, charge management and failure behaviour. Use the profile for material qualification and a properly defined mill comparison for consumption performance.
RFQ checklist
- Rod diameter, length and mill operating conditions.
- Proposed grade, heat-treatment condition and radial hardness ranges.
- Measurement locations, hardness method, sampling and retest rules.
- Impact or bend-test requirements and acceptance criteria.
- Trial duration, consumption basis and recovered-rod observations.
References
Product and laboratory photographs: JOTAIN Materials. Research figures: Tong et al., CC BY 4.0, and the U.S. Bureau of Mines, public domain. Hardness chart and wear diagram: JOTAIN Materials.
- Arnett, C. R.; Bruner, J. P. Bainitic core grinding rod, EP 0336090 B1, 19 January 1994, pp. 3–4. Patent record.
- Pugh, R. W.; Ma, S. L. Heat Treated Grinding Rods. Canadian Institute of Mining, Metallurgy and Petroleum, 1993. Abstract.
- Tong, Y.; Zhang, Y.-Q.; Zhao, J.; Quan, G.-Z.; Xiong, W. Wear-Resistance Improvement of 65Mn Low-Alloy Steel through Adjusting Grain Refinement by Cyclic Heat Treatment. Materials 2021, 14(24), 7636. Figures 3 and 17 reproduced unchanged, © 2021 the authors, CC BY 4.0. Open-access full text.
- ASTM International. ASTM E18-25: Standard Test Methods for Rockwell Hardness of Metallic Materials. Scope and significance-and-use summary.
- Low, S. R., III. NIST Recommended Practice Guide: Rockwell Hardness Measurement of Metallic Materials. NIST SP 960-5, 2001.
- ISO. ISO 18265:2013: Metallic materials—Conversion of hardness values. Scope; confirmed in 2024.
- ASTM International. ASTM A370-26: Standard Test Methods and Definitions for Mechanical Testing of Steel Products. Scope.
- Isaacson, A. E.; McDonough, P. J.; Maysilles, J. H. Determining Corrosion Rates in Industrial Ore Grinding Environments. U.S. Bureau of Mines RI 9166, 1988. Figure 18, p. 20. Full report, public domain.
Inquiry support
Unsure which processing route to quote?
Send the drawing or RFQ with the grade, size, condition, processing, inspection, quantity, and destination. We can flag open points before quotation.